fantastic Projection wow REal company real valueCHECK THE WEB SITE YOU WILL know why not the mindless do your research
Crypto market

TRB: Watch for Key Breaks to Validate Bullish Trend!💎 Paradisers, #TRBUSDT has broken out of a falling wedge pattern and has now formed a 'W' pattern, which increases the likelihood of a bullish move.
💎 If #TRB closes a candle above the resistance level, it will validate the pattern, and we can set our targets at the previous swings.
💎 However, if the price closes a candle below the demand zone, it will invalidate our entire bullish idea. In that case, it would be better to disregard this setup and wait for more favorable price action to develop.
MyCryptoParadise
iFeel the success🌴

BNB trade idea for a scalpJust took a trade in BNB as a scalp , lets see how does it goes
Key Levels:
Support Levels: $530.6, $450.8, and $375.6
Resistance Levels: $614 and $679 (previous ATH)

MINU crypto has experienced a surge
The MINU Crypto showed furious bears on the daily chart, the bull was suppressed by bears over the daily chart for a long time, This led the MINU price to form lower lows and high patterns under the influence of a downward trendline.
However, the MINU crypto has revealed multiple signs of recovery as the price formed support at $0.0000001045. This was the key level where bears started losing their grip, and bulls showed resurgence capabilities on the daily chart. The MINU looks more optimistic than before as the price has broken out of the declining trendline and has been riding an upward trendline and took multiple backing from the trendline.
This could be the outbreak point where the bulls may send it flying on its fourth attempt from the daily chart. Therefore, if the bulls pour enough strength, the MINU crypto could show a colossal surge, crack the resistance level, and rocket to new peaks from the current support zone.
Coming to the indicators point of view, the MINU asset has exhibited bullish strength and rising capacity as it holds above 20-day EMA's.
Similarly, the MINU asset has displayed bullish behavior, as the MACD histogram gap has started to widen, which stands at 0.0000000150, and the RSI has not been near the 70 level yet, meaning that the MINU asset has not been facing much of a resistance and can extend its gains.
At press time, the MINU crypto has experienced a surge of 52.43% in the last 24 hours, trading at $0.0000003510.
Therefore, if the demand for the MINU remains high, the asset price could bounce back strongly from the current level. Then next target for the price could be to reach $0.0000007200 and $0.0000010150.
However, if the MINU crypto price fails to stay above the $0.0000001045 level, it could decline further and could seek rock bottom as well.

the MAGA (TRUMPI has been riding on a upward trendlineAt press time, the MAGA (TRUMPI has been riding on a upward trendline from may 9th from price $4.00, and has been trading at $14.232 with an intraday loss at -5.66%.
Meanwhile, Super Trump has declined -18.07%, which has been trading at $0.01150. The MAGA has recovered after the dip in response to the conviction news, but STRUMP has continued to plunge.

JASMY: Potential Bullish Move Pending Confirmation!☕️💎 Paradisers, #JASMY could present a bullish move if the price ascends from its current position and breaks out above the resistive trendline and resistance zone, enhancing the likelihood of a bullish trajectory.
💎 In the event of a pullback, we can anticipate a bounce from the demand zone, but caution is advised here. Ensure you wait for confirmation within this zone before making any moves.
💎 However, if the price breaks down below the demand zone, it will invalidate all the bullish signs. In that case, it would be better to wait for more favorable price action to develop.

ONDO: Inverse Head and Shoulders Signals Upcoming Breakout🚀💎 Paradisers, after significant consolidation, #ONDOUSDT is showing an inverse head and shoulders pattern, which increases the likelihood of a bullish move.
💎 If #ONDO breaks above the resistance level and closes a candle above it, this will validate the inverse head and shoulders pattern, and we can then expect a bullish move.
💎 In the case of a pullback, we can expect a bounce from the bullish Order Block (OB) + Fair Value Gap (FVG) zone. Remember that if the price goes below the right shoulder, it will invalidate the inverse head and shoulders pattern.
💎 However, if the price doesn't show any bullish signs at the bullish OB and falls below it, closing the candle below, then it will invalidate our idea. In that case, it would be better to wait for more favorable price action to develop.

Ethereum Technical Analysis - ETH has been very dominant in the crypto market recently because of its ETF Approval
- A lot of people are missing out on the S-1 Form Approval and bought the FOMO
- Institutions are going to bring back prices to the equilibrium and make sure they are accumulating things for cheap
- 3100-3400$ can act as a very strong Demand/Area Of Interest that can easily bring price down and then show another impulsive move towards 5000$
- Ethereum looks bearish as of now/short term so take decisions accordingly

Bitcoin Technical Analysis - Bitcoin is trying to take some support from the zone of 67,000$
- Bitcoin on a Daily TF looks different its trying to consolidate and find a support that can stop its further drawdown
- The market from a technical perspective isn't portraying much bearish/bullish bias
- One catalyst can bring down/up prices more
- If you are looking for entries then I would highly recommend to wait for the weekends when you see prices filling back imbalances
- 63,000-65,000$ WILL BE A VERY GOOD ZONE TO ACCUMULATE ALT/ETH/BTC

#ETH/BTC Analysis: Major Support Trendline and Falling Wedge Bre#ETH/BTC Analysis: Major Support Trendline and Falling Wedge Breakout
The 3ETH/BTC trading pair has been in a downtrend for the past 28 months, consistently forming lower highs and lower lows. However, recent price action indicates a potential reversal pattern that could signal the end of this prolonged bearish phase. Ethereum is currently taking support from a significant trendline and has formed a falling wedge, a bullish reversal pattern. Traders and investors are now eagerly awaiting a breakout, which could pave the way for Ethereum to reach new all-time highs, potentially hitting the $15,000 mark against Bitcoin.
**Major Support Trendline:**
Over the past 28 months, ETH/BTC has been respecting a major support trendline. This trendline has acted as a critical support level, preventing further declines on multiple occasions. Recently, Ethereum has once again found support at this trendline, indicating a strong base and potential for a reversal.
**Falling Wedge Pattern:**
A falling wedge is typically considered a bullish reversal pattern that forms after a downtrend. It is characterized by converging trendlines that slope downwards, with the upper trendline having a steeper slope than the lower one. In the case of ETH/BTC, the falling wedge pattern has been forming over several months, signaling that the downtrend might be losing momentum.
**Breakout Confirmation:**
For the falling wedge pattern to be validated, ETH/BTC needs to break above the upper trendline of the wedge. A confirmed breakout would typically be accompanied by increased trading volume, indicating strong buying interest. Once this breakout is confirmed, it would suggest that the bearish trend has ended, and a new bullish phase is beginning.
**Price Target:**
The breakout from the falling wedge pattern could lead to significant upward momentum for ETH/BTC. Based on technical analysis and historical price movements, Ethereum could reach new all-time highs, potentially climbing to the $15,000 level against Bitcoin. This price target is derived from measuring the height of the wedge at its widest point and projecting it upwards from the breakout level.
**Conclusion:**
The #ETH/BTC pair has been in a downtrend for the past 28 months, but recent price action indicates that a reversal might be on the horizon. Ethereum is taking support from a major trendline and has formed a falling wedge pattern, both of which are bullish signals. Traders and investors should keep a close eye on the price action for a confirmed breakout above the upper trendline of the wedge. If this breakout occurs, it could propel ETH/BTC to new all-time highs, potentially reaching the $15,000 mark. This presents a compelling opportunity for those looking to capitalize on Ethereum's next major bullish run.

Can Zilliqa (ZIL) Maintain a Bearish Stance Or Take A Rebound?Can Zilliqa (ZIL) Maintain a Bearish Stance Or Take A Rebound?
Social metrics of Zilliqa crypto are improving hinting a possible recovery in the upcoming sessions.
The daily chart reveals a bearish crossover of the key 50 and 200 day EMAs pointing to a weakness prevailing in the market.
Zilliqa Crypto has been struggling to make a comeback in the recent sessions and break out of a correction phase. The bears are attempting to make a trend reversal in their favor. On the flip side, the bulls are actively trying to defend previous swing low to keep the trend in their favor, leading to a consolidation near the support level.
Moreover, the social metrics i.e. social dominance and social volume have reported a positive growth suggesting a potential optimism ahead. However, a bearish crossover of 50 and 200 day EMAs casts doubt on an immediate upward movement.
Let's look into a more thorough analysis and try to figure out the potential direction of Zilliqa price in the upcoming sessions.
Rising Social Metrics Signals Bullish Days Ahead
As per the data obtained from a financial website app.santiment.net, there has been a notable rise in the social dominance as well as the social volume metrics in the recent sessions. The social dominance has jumped form 0.021% to 0.075% suggesting a possible uplift in the price.
The social dominance and social volume chart reflects change in awareness and the popularity of the ZIL crypto among the users. Social media platforms like Twitter, Instagram and Facebook act as a medium for the crypto to spread its presence and appeal.
Moreover, an increased activity in social metrics suggests the rising participation of the users which ultimately results in an increased demand. Generally it has a positive impact on the price in the short term.
Can A Bearish Crossover Result In A Negative Trend Shift?
Moreover, the daily chart witnesses a bearish crossover of the key Exponential moving averages of 50 and 200 days suggesting the continuation of a negative trend. Yet, the price hasn't fallen below the recent low, which would confirm a bearish reversal in the trend.
On the flip side, the bulls are holding firmly above the recent swing low and are intending to keep the price trend in their favor. Currently, the daily chart is witnessing a consolidation and sideways trend.
Now, if the bulls are able to surpass the price beyond the $0.025 level, it may invalidate a bearish crossover and confirm breakout from a correction phase. whereas if the bears dominate and the price drops below the $0.022 level it may indicate a trend reversal potentially leading to a drop to $0.02 level.
Conclusion.
Zilliqa Crypto is in a correction phase, with the bulls trying to defend the low to maintain an uptrend. A rise in social dominance from 0.021% to 0.075% hints at a price boost. However, a bearish crossover of the 50 and 200-day EMAs formed over the daily chart indicates weakness in the price.
Now, If the bulls are able to surpass above $0.025, it could signal the end of a correction phase. whereas, If the price falls below $0.022, a bearish trend towards the $0.02 may follow.

Is Solana Crypto Ready To Take A Big Leap Towards The $200 Mark?Is Solana Crypto Ready To Take A Big Leap Towards The $200 Mark?
Solana crypto is exhibiting consolidation near the 20-day Exponential Moving Average (EMA), hinting at a potential breakout in the upcoming sessions.
The Relative Strength Index (RSI) and 14-day Simple Moving Average (SMA) have both crossed the mean line, signaling a bullish trend on the horizon.
Solana crypto has exhibited a steady pattern, consolidating at the 20-day Exponential Moving Average (EMA) across the last six intraday sessions. This stabilization phase followed a pullback from the upper resistance level of around $190.
Furthermore, the pattern of price stabilization succeeding a decline suggests the formation of a 'higher low' on the daily chart. Additionally, a notable shift in the volume inflow and the total value locked (TVL) hints at a bullish trend emerging.
Let's delve deeper into the same and explore the potential trajectory of Solana's (SOL) price in the forthcoming trading sessions.
TVL On The Rise While Volume Dropped
As per data obtained from a financial website defillama.com, Solana has witnessed a notable increase in its Total Value Locked (TVL). In April, there was a decrease in TVL from $4.87 billion to $3.86 billion, however it has since rebounded to $4.97 billion.
Moreover, TVL represents the amount of capital that is staked or secured within the blockchain. A gradual increase in TVL can be interpreted as a shift in market engagement, a growing demand for the project, and a heightened commitment from investors.
In addition, the recent sessions have seen a decline in trading volume concurrent with a dip in Solana's price, suggesting a waning interest from sellers. This could potentially signal an upcoming bullish trend.
Is Solana Ready For A Bull Run?
The technical analysis indicates that the long-term trajectory for SOL price is bullish, remaining well above the crucial 200-day Exponential Moving Average (EMA). However, In the near term, the price appears to be retracing, potentially setting the stage for an upcoming bullish phase.
Currently, the price is consolidating, and this phase could conclude if buyers manage to push the price beyond the $175 threshold. Should the price sustain an upward trend, short-term traders and investors might look at $188 and $200 as subsequent levels for realizing profits.
Conversely, if the Solana (SOL) price continues to trade below the $175 level, it may persist in consolidation and could further correct down to the $160 and $150 support levels.
Conclusion.
Solana (SOL) crypto is consolidating near the 20-day EMA after a decline from $190, indicating a potential 'higher low' formation. TVL has rebounded from $3.86 billion to $4.97 billion, suggesting increased market engagement and investor confidence.
Despite a recent volume decrease, the long-term outlook is bullish above the 200-day EMA. Now, If Solana surpasses $175, it may target $188 and $200. Otherwise, it could correct to $160 or $150. This analysis points to a possible bullish trend if the consolidation phase ends with a breakthrough above the $175 level.

ARB Dropped By 7% In Last One Year, Will A Bullish Trend Come SoArbitrum has a market cap of $3.23 Billion and is ranked 32nd in the cryptoverse. The volume of the ARB has seen a drop of 10% in the intraday session. The VM ratio of the ARB token is 0.1 suggesting a consolidation in price. The token price is currently trading near $1.15 with a slight gain in the intraday session.
The asset price is forming a consolidating range of candles on the daily chart. It is trading below the 50 and 100 EMA. The upside momentum of price can see a halt near $1.35. Meanwhile the support price for ARB can be seen near $1
The RSI of ARB token is near 51 with no slope in it. The overall sentiment of the RSI is neutral in nature.

MACD portrays a bullish crossThe Decentraland price chart an intense match between bulls and bears, initially, bulls had control, but later shift in the wind dropped the game in bears' favor. The recent price action shows an uncertain to bullish situation, as analyst are optimistic about it.
At press time, the price has traded at $0.4514 with an intraday slight fall of -0.27%, with a market capitalization of $862.75 Million, and 24-hour trading volume at 57..99 Million.
An analyst, CryptoRand, Tweeted with the bullish sentiment on the X platform that In Decentraland (MANA) a breakout has taken place out of a main downtrend based trendline on the daily chart. He further stated that it looks in a consolidation after breachiung the trendline, and looking primed for an upcoming rally in the coming sessions.
Similarly, based on the analyst tweet, the MANA asset daily chart shows that it has been consolidating between the 20-day, and 50-day EMAs. This appears to be portraying bullish strength in the short-term, that could drive its price for $1.0.
Likewise, the MACD portrays a bullish cross, with a rising histogram in MANA at 0.0031, and the RSI flashed at 50.41. It portrayed that the Decentraland crypto happens to be low on the momentum yet, as its sideways in a tight range, it appears not like a losing steam yet and it could burst anytime soon for continuing to climb higher in future sessions.
Therefore, if the breakout rallies strongly, the next goal for the MANA price could be to reach the above levels, such as $0.5600, $0.7000 and $0.8000. On surpassing these hurdles, the doors could open for $1.0 price mark as well.
On the contrary, if the price plunges then in this scenario, if the Decentraland crypto price fails to stay above the $0.4000 level, it could also decline further for lower levels.

DOGE asset has showed bullish signsThe DOGE crypto has showed itense match between bulls and bears. As the price approcahes the beginning of June, investors are keenly watching for crypto to reclaim previous supply at $0.228. Furthermore, the DOGE crypto shhows bullish potential, as it stays above 50-day, and 200-day EMA's, and riding on an upward trendline after breaking out of a bullish pattern.
The DOGE crypto has revealed a breakout from the wedge and the pullback scenario has been created in the DOGE, which seems to be optimistic for crypto.
After breaching the wedge upper boundary, the price takes support from $0.15275 which has been a crucial level for DOGE price to achieve a parabolic move.
Overall, on the crypto chart, it appears that DOGE Memecoin poised for an colossal surge, to crack the resistance level and rocket to $0.228, which could be a 30% gains (approx.) in the coming weeks or in the short-term probably.
An analyst post on X by Altcoin Sherpa shared a positive approach for the Dogecoin price in the long term. He further added that this cycle it could go for the target $0.40 price mark, which are historical level that acts as a magnet.
Sherpa also stated that the DOGEcoin looks promising and could probably outperform a lot of other shitcoins. Meanwhile, it has a great liquidity relative to other meme coin, all it takes for the crypto to send flying is a one retarded tweet from ELON to blow it up.
Doge Price Forecast, And Oscillators Overview!
The DOGE asset has exhibited bullish strength and rising capacity as it holds above major 50-day, and 200-day EMA's.
The asset displays bullishness, as MACD line at 0.00329, which happens to be above the zero line and the RSI flashed at 50.98 level.
as per the indicator tools, the DOGE asset has showed bullish signs as well and it has the potential to surge further. It has performed well in the past month, and quarter by 11.31%, and 35.93% respectively, thus, indicating a strong uptrend.
Therefore, if the demand for the crypto remains high, the DOGE asset price could bounce back from the current level. The next target for the price could be to reach $0.228, and $0.400.
However, if the Dogecoin crypto price fails to cross above previous wing high at $0.17500 and fails to stay above the $0.15275 level, it could decline further, as well.


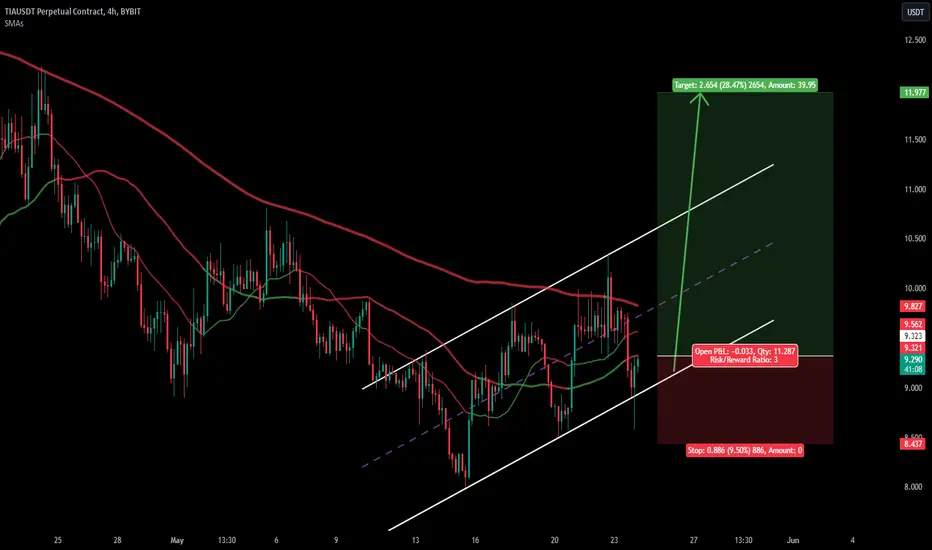
TIAUSDT bullish on 4H chart for 1:3 ratioBased on the provided data, the current support and resistance levels for TIA against USDT are as follows:
Support Level: $8.429 (SL)
Resistance Level: $11.98 (Target)
These levels are derived from the latest trendlines, parallel channel support and resistance prices. The support level indicates a price at which there is potential buying pressure, preventing the price from declining further. On the other hand, the resistance level represents a price at which there is potential selling pressure, preventing the price from rising further.
It's important to note that support and resistance levels are not fixed and can change over time as market conditions evolve. Traders and investors often use these levels to make decisions regarding entry and exit points for their trades.
the next goal for the TON price could be to reach the above Ton price was in an uptrend, and the price stayed above 50-day, and 200-day EMA on the daily chart. From last few sessions, the TON has been developing low momentum candles, signifying consolidation.
An analyst, Mister Crypto, Tweeted with the bullish sentiment on the X platform that In TonCoin (TON) a breakout appears imminent out of a symmetrical triangle pattern on the daily chart.
Similarly, based on the analyst tweet, the TON asset daily chart also shows bullish gestures. Likewise, the MACD line happens to be above the zero line with an anticipated bullish cross and the RSI flashed at 55.41.
Therefore, if the breakout occurs, the next goal for the TON price could be to reach the above levels, such as $7.00 and $8.0.
On the contrary, if the price continues to trade inside the pattern again, the pattern made in TON or if the crypto price fails to stay above the $6.0 level, it could also decline further towards, $5.0 support.

Bitcoin Bybit chart analysis May 29Hello
It's a Bitcoinguide.
If you have a "follower"
You can receive comment notifications on real-time travel routes and major sections.
If my analysis is helpful,
Please would like one booster button at the bottom.
Bitcoin 30-minute chart.
Because today is JP’s birthday,
Because I am having dinner with my mother, I will upload the analysis earlier than usual.
First of all, the beat is the purple finger on the left
As a maintenance condition after entering a long position of $68,310
The strategy was connected as is.
There is no Nasdaq indicator announcement today.
Both Nasdaq and Bitcoin
The MACD deadcross pressure on the daily chart is in progress.
Bollinger Band 1-hour chart resistance line around 11:00 a.m.
After touching the best short position
A correction is taking place along with the Nasdaq.
I will die together with those who were with me yesterday.
*Sky blue finger movement path
Two-way neutral
Short -> Long switching strategy
1. Short position entry area of $69376.5 / Stop loss when the orange resistance line is broken
2. Switching long position at $67,105 / Stop loss when breaking out of the light blue support line
If it deviates from the green support line at the current position
Those of you who were maintaining a long position yesterday may proceed with a stop loss.
If adjustments continue to be made
I think it would be good to look at the light blue support line at the bottom -> Bottom section.
Everyone knows and is waiting for the bottom spot.
Although it is a 12+ day period, the daily chart MACD deadcross may occur depending on the situation.
Please be careful as it may not be engraved.
Once the daily MACD deadcross is resolved,
I think we will break the previous high again, but it won't be easy.
My analysis up to this point is
Please simply refer to it and use it.
Please operate safely with principled trading and stop loss required.
thank you

#ETH/BTC Falling Wedge: Ready for a Bullish Breakout#ETH/BTC Analysis: Major Support Trendline and Falling Wedge Breakout
The 3ETH/BTC trading pair has been in a downtrend for the past 28 months, consistently forming lower highs and lower lows. However, recent price action indicates a potential reversal pattern that could signal the end of this prolonged bearish phase. Ethereum is currently taking support from a significant trendline and has formed a falling wedge, a bullish reversal pattern. Traders and investors are now eagerly awaiting a breakout, which could pave the way for Ethereum to reach new all-time highs, potentially hitting the $15,000 mark against Bitcoin.
**Major Support Trendline:**
Over the past 28 months, ETH/BTC has been respecting a major support trendline. This trendline has acted as a critical support level, preventing further declines on multiple occasions. Recently, Ethereum has once again found support at this trendline, indicating a strong base and potential for a reversal.
**Falling Wedge Pattern:**
A falling wedge is typically considered a bullish reversal pattern that forms after a downtrend. It is characterized by converging trendlines that slope downwards, with the upper trendline having a steeper slope than the lower one. In the case of ETH/BTC, the falling wedge pattern has been forming over several months, signaling that the downtrend might be losing momentum.
**Breakout Confirmation:**
For the falling wedge pattern to be validated, ETH/BTC needs to break above the upper trendline of the wedge. A confirmed breakout would typically be accompanied by increased trading volume, indicating strong buying interest. Once this breakout is confirmed, it would suggest that the bearish trend has ended, and a new bullish phase is beginning.
**Price Target:**
The breakout from the falling wedge pattern could lead to significant upward momentum for ETH/BTC. Based on technical analysis and historical price movements, Ethereum could reach new all-time highs, potentially climbing to the $15,000 level against Bitcoin. This price target is derived from measuring the height of the wedge at its widest point and projecting it upwards from the breakout level.
**Conclusion:**
The #ETH/BTC pair has been in a downtrend for the past 28 months, but recent price action indicates that a reversal might be on the horizon. Ethereum is taking support from a major trendline and has formed a falling wedge pattern, both of which are bullish signals. Traders and investors should keep a close eye on the price action for a confirmed breakout above the upper trendline of the wedge. If this breakout occurs, it could propel ETH/BTC to new all-time highs, potentially reaching the $15,000 mark. This presents a compelling opportunity for those looking to capitalize on Ethereum's next major bullish run.

XRP Faces Resistance: Potential Downtrend or Breakout?We're approaching a key resistance level marked by the red box on the chart.
Prediction:
Potential Downtrend: A bearish rejection at the resistance zone could signal a price reversal and downtrend.

CHZUSDT : Can It Overcome Resistance for a Major Rally?💎 Paradisers, #CHZUSDT has formed an inverse head and shoulders pattern, increasing the probability of a bullish move.
💎 The #CHZ is also showing a bullish market structure. If it breaks out above the resistance zone and closes a candle above it, this will validate the inverse head and shoulders pattern and could propel the price towards our resistance levels.
💎 In the case of a pullback, we can expect a bounce from the demand level, but entries here could be riskier. Therefore, it's better to look for A+ setups on lower timeframes for confirmation.
💎 However, if the price closes a candle below the demand level, it will invalidate the pattern and our bullish outlook. In that scenario, it would be better to reassess the market conditions.
MyCryptoParadise
iFeel the success🌴

BITCOIN: Bearish - Double TOP + Rising WedgeBITCOIN: Bearish – Double TOP + Rising Wedge
The market could go back down to around $58 000.
In addition, detection of a possible double top on Bitcoin which would bring the price down to around $48 000
Watch for the 50 and 200 exponential moving averages, as well as the Ichimoku levels, and RSI.
be careful
