Is Wave (III) Starting in NSE Stock Syncom?🧬 SYNCOM Can Wave (III) Push It to ₹47+?
NSE:SYNCOMF appears to be developing an interesting Elliott Wave structure on the weekly chart . The advance from 4.60 to 27.90 can be interpreted as a five-wave impulse, potentially completing a larger Wave (I) . Price then corrected from 27.90
Where the world does markets
Join 100 million traders and investors taking the future into their own hands.
Get started for free$0 forever, no credit card needed

Supercharged
Supercharts

GLAND Symmetrical Triangle Breakout with Strong Volume🔥 Gland Pharma: Symmetrical Triangle Breakout with Strong Volume
📊 MARKET STRUCTURE SNAPSHOT | NSE: GLAND | DAILY
Closing Price: 3,150.60
Core Trend: Uptrend
Market State: Breakout
Chart Pattern: Symmetrical Triangle — Bullish Breakout
Candlestick Pattern: Strong Bullish Candle
Price Structure: Pric
Physicswallah (D): DUAL CONFLUENCE BREAKOUTTimeframe: Daily | Chart Scale: Linear
Explosive +5.85% surge today backed by a massive 34.92M volume spike! 🔥
Technical Highlights:
✅ Breakout: Cleared & closed above BOTH an angular AND horizontal resistance (active since Jul '26).
✅ Volume Reversal: Volume rising over the past couple
Too Much Ado at 4125: Bullish Defense Before FOMCProbable Scenario Analysis of Gold (XAUUSD) FX:XAUUSD before a high-impact event and two medium-impact events.
⏺ Present Scenario
The bearish phase is intact. However, the market is sideways for multiple days. It is a sign of consolidation. The breakout or breakdown will be severe. There are
Anand Rathi Wealth: Wave 5 Ahead or Bigger Wave (4)?From the March 2025 low of 797, this stock has almost tripled. The move fits a clean Elliott Wave structure.
Wave (1) and (2): Wave (1) ran from 797 to 1,660.7. Wave (2) fell to 1,353.9, taking back only 35.5% of wave (1). That's a shallow dip, which shows buyers stayed strong.
Wave (3) so far:
CASTROLIND : Contraction Before ExpansionNSE:CASTROLIND has express some better strength after a year long consolidation. What we can further observe with the current price action is as below.
Key Observations:
1. An attempt to escape from base consolidation as primary expressions.
2. The daily chart demonstrates a clear shift from a
ONE POINT ONE SOLUTIONS LTD — ELLIOTT WAVE & PRICE STRUCTUREOne Point One Solutions is currently showing a potentially important Elliott Wave completion and accumulation structure.
The larger price structure appears to have completed a corrective W-X-Y pattern, with the recent price action developing from the ₹40–52 support/accumulation region. The stock ha
XAU/USD - Sellers Control Downward StructureOANDA:XAUUSD remains under bearish pressure on the H4 chart, with price still moving inside a well-defined descending channel and holding beneath the Ichimoku cloud. The recent breakdown damaged the previous support structure, while the recovery from the 4,140 area has so far looked more correctiv
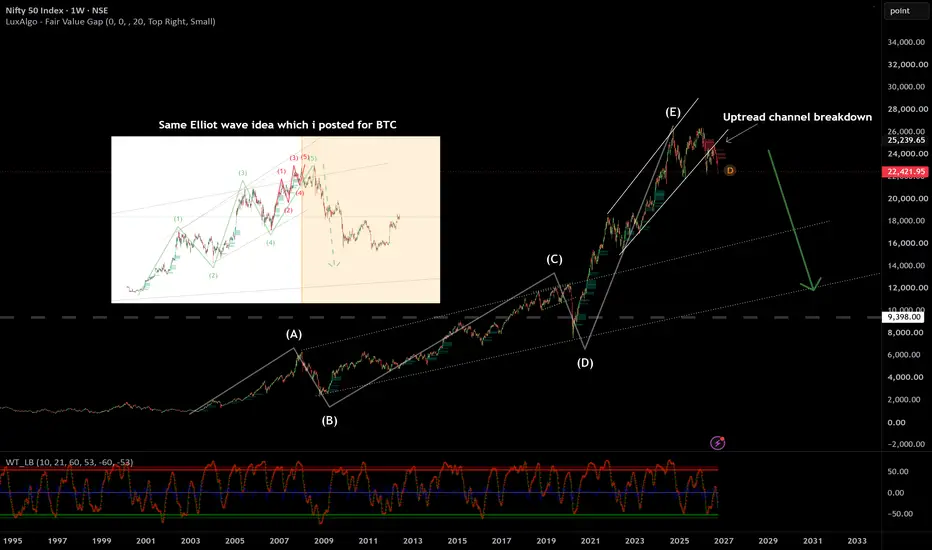
NIFTY 50: Elliott Wave Warning of a Potential Multi-Year BearNIFTY 50: Elliott Wave Warning of a Potential Multi-Year Bear Market
Applied Elliott Wave analysis on the weekly timeframe.
NIFTY appears to have completed a large ABCDE corrective/wedge structure.
Wave (E) may have topped near the recent all-time highs around 26,000.
Current price action suggests
See all editors' picks ideas
RedK Indicator Amplifier (RedK i-Amp)🟩 What is RedK i-Amp?
-------------------------------
RedK i-Amp is not an indicator in itself - it's a "wrapper" utility that "amplifies" another "source" indicator by improving its visual and alerting capabilities.
RedK i-Amp hooks to another indicator's plot and enables the addition of the fol
TASC 2026.10 A Low-Risk ETF-Trading Strategy█ OVERVIEW
This script implements concepts from a short-term ETF investment strategy outlined by Markos Katsanos in the article "Selecting Strong ETFs While Avoiding Sharp Overbought Reversals" from the October 2026 edition of TASC Traders' Tips . The strategy analyzes Katsanos' custom relative s
Buyers & Sellers Profile + Dynamic S/R (Zeiierman)█ Overview
Buyers & Sellers Profile + Dynamic S/R (Zeiierman) is a volume-profile and market-structure indicator designed to combine a large rolling Buyers/Sellers Volume Profile with dynamically generated support and resistance levels.
Instead of treating the volume profile and swing structure
Vol-Control Fund PositioningThe investors who sell because nothing happened
In 2017 the American stock market was so calm that a whole class of institutional portfolios held more equities than their own capital, simply because the rules they follow told them to. Reconstructed with the model behind this indicator, their estim
RedK Multi-Modal TrailingStop (RedK MMTStop)█ RedK MMTStop - Release Notes
Introduction & background
RedK MMTStop is a Multi-Modal Trailing Stop indicator - Let's quickly explore the "trailing stop" concept first as a refresher - then explain what a multi-modal trailing stop indicator does.
A "Trailing Stop" is what helps traders avoi
Trend Target Ribbon [BOSWaves]Trend Target Ribbon - ALMA Conviction Trend Detection with Integrated Structure-Based Position Planning and R-Multiple Target Tracking
Overview
Trend Target Ribbon is an ALMA-based trend identification system that combines slope-normalized momentum confirmation with standard deviation band
Wyckoff [theUltimator5]This indicator was designed to be a comprehensive, intuitive, overly engineered algorithm that plots Wyckoff accumulation and distribution patterns on the chart as they arise. It shows the current status of the regime on a side panel, while also overlaying the accumulation or distribution schematic
XeL OnlineRecursionXeL OnlineRecursion is a Pine Script library for online and streaming statistical estimation on continuous numerical and financial data.
The library is designed around recursive statistical populations whose retained state is updated observation by observation. Most recursive components use consta
Dual-Phase Reversal by DGTDual-Phase Reversal • Exhaustion, Pivots & Pressure
Dual-Phase Reversal (DPR) is a two-phase market exhaustion framework that tracks directional momentum through Momentum Exhaustion and Terminal Exhaustion . It combines sequential price conditions, Momentum Shift initiation, phase qualificatio
Zeiierman Trend Pressure (Zeiierman)█ Overview
Zeiierman Trend Pressure (Zeiierman) is a multi-layer trend pressure and exhaustion oscillator designed to visualize short-term momentum, persistent trend structure, directional pressure, and exhaustion states within a normalized 0 to -100 range.
Instead of relying on a single osci
See all indicators and strategies
Community trends
GLAND Symmetrical Triangle Breakout with Strong Volume🔥 Gland Pharma: Symmetrical Triangle Breakout with Strong Volume
📊 MARKET STRUCTURE SNAPSHOT | NSE: GLAND | DAILY
Closing Price: 3,150.60
Core Trend: Uptrend
Market State: Breakout
Chart Pattern: Symmetrical Triangle — Bullish Breakout
Candlestick Pattern: Strong Bullish Candle
Price Structure: Pric
Physicswallah (D): DUAL CONFLUENCE BREAKOUTTimeframe: Daily | Chart Scale: Linear
Explosive +5.85% surge today backed by a massive 34.92M volume spike! 🔥
Technical Highlights:
✅ Breakout: Cleared & closed above BOTH an angular AND horizontal resistance (active since Jul '26).
✅ Volume Reversal: Volume rising over the past couple
Is Wave (III) Starting in NSE Stock Syncom?🧬 SYNCOM Can Wave (III) Push It to ₹47+?
NSE:SYNCOMF appears to be developing an interesting Elliott Wave structure on the weekly chart . The advance from 4.60 to 27.90 can be interpreted as a five-wave impulse, potentially completing a larger Wave (I) . Price then corrected from 27.90
SBI 3M Chart: Potential Double Top at the NecklineSBI’s 3-month chart is showing a potential Double Top following a strong upward trend.
The first peak was followed by a pullback. Price then rallied toward the previous resistance zone, forming a second, slightly lower peak and showing rejection near that area.
The reaction low between these two p
Arfin India Has Finally Broken Out Now Momentum Can ExplodeArfin India has finally done what buyers were trying to achieve for months. The falling trendline that rejected price repeatedly around the 98–104 zone has now been broken with a strong bullish candle and a massive expansion in volume. What makes this breakout more powerful is the structure undernea
Black Box: Bullish Recovery Setup with 1,020 Target Black Box is showing a recovery from the 709 low, with momentum improving. Price is now above 841, which is the key support level. A sustained move above 893 can strengthen the bullish setup. Upside targets are around 953 – 1,020 .
The setup stays positive as long as 841 holds. A break belo
Breakout Isn’t the Opportunity — What Happens AFTER It IsThis is not a Recommendation to Buy, Sell or Hold, This is a Method, how to analyse Stocks on your own and what Location is great to do so .
One of the biggest differences between finding a stock worth analysing and simply chasing price is understanding what happens after an important supply zone
THELEELA Bullish Cup BreakoutThe price action has formed a classic 'Cup' or rounding bottom pattern.
This indicates a gradual accumulation phase and a clear shift in momentum from sellers to buyers.
Breakout: The price successfully broke out of the neckline resistance at 580.55.
The 580.55 mark held firm as new support, follow
One 97 Communications (PAYTM): Waves, Volume and RSIEducational wave study only. Not a buy or sell recommendation.
From the March low of 930.6, this stock has moved up in a clean rising channel. The waves, the volume and the RSI all tell the same story.
Wave (1) and (2): Wave (1) went from 930.6 to 1,223 in a choppy, overlapping way. It looks li
See all stocks ideas
Tomorrow
POONAWALLAPoonawalla Fincorp Limited
Actual
—
Estimate
4.20
INR
Tomorrow
ANANDRATHIAnand Rathi Wealth Ltd.
Actual
—
Estimate
—
Tomorrow
CANFINHOMECan Fin Homes Ltd.
Actual
—
Estimate
20.28
INR
Oct 10
DMARTAvenue Supermarts Ltd.
Actual
—
Estimate
13.64
INR
Oct 12
HCLTECHHCL Technologies Limited
Actual
—
Estimate
17.87
INR
Oct 12
GSFCGujarat State Fertilizers & Chemicals Limited
Actual
—
Estimate
7.30
INR
Oct 12
RBLBANKRBL Bank Ltd.
Actual
—
Estimate
3.12
INR
Oct 12
SWARAJENGSwaraj Engines Ltd
Actual
—
Estimate
—
See more events
Community trends
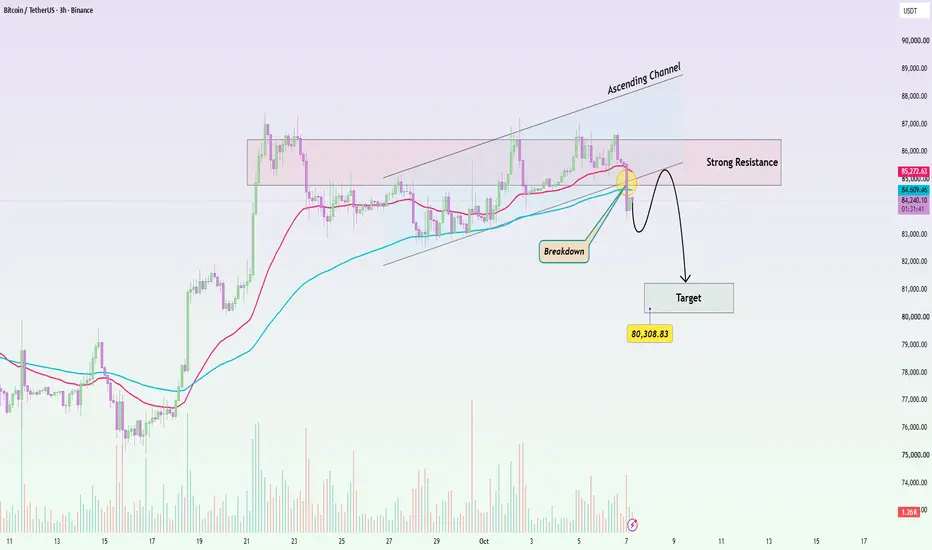
BTCUSDT: Channel Breakdown Turns Into ResistanceBitcoin has broken below the lower boundary of its ascending channel, and price is now trading around $84,200, below both short-term EMAs. That weakens the previous bullish structure and shifts attention toward a deeper correction.
The important area is now roughly $84,600–$86,300. This zone previo
Oversold MarketsWhat is overbought?
When the market goes up too much, too fast — like it got overexcited. RSI crosses above 70. This means most people who wanted to buy have already bought. Not many buyers left. So the market will likely slow down or fall a bit.
What you do: don't buy now. If you're already in pro
BTC USD 45 Minute Chart Market Structure
The previous bullish structure lost momentum after price failed several times to sustain above the 86000 to 86700 supply area. The subsequent sharp sell off produced strong bearish momentum and pushed Bitcoin below the previous short term support structure.
Price is now moving ins
B Long

Order block and 200 EMAThis is an uptrend, and price retraced towards the 200 EMA. It retraced very strongly but could not cross RSI < 30, then took support at the 200 EMA. This level also is equivalent to an order block, which I have marked. Price jumped again and filled up the last bearish fair value gap with strong bul
BTC/USD Weekly Analysis: Cycle Projection to 2031📊 Technical Analysis
1. Multi-Year Macro Channel & Structural Integrity
On the weekly timeframe, Bitcoin continues to evolve strictly within its long-term ascending macro channel boundaries.
Historical Lower Support Band: Formed by connecting major swing lows from prior multi-year cycles (including
BTC/USDT - Breakout Holds, 91.8 Comes Into ViewBINANCE:BTCUSDT continues to build on the bullish breakout from the descending trendline that had capped price through most of September. The move above that structure was followed by a strong expansion higher, and price is now holding above the H4 Ichimoku cloud rather than immediately giving the
Volatility Contraction: Check Ranges and BoundariesVolatility contraction occurs when candles narrow and successive swings cover less distance. It is sometimes described as "stored energy": price is compressing into a smaller area that may later give way to a wider move. The metaphor does not establish when expansion will happen or which direction i
BTC is currently trading around 85,124.Price has reacted strongly from the lower demand area around 83,930–84,100 and has started forming higher lows. The structure suggests that buyers are attempting to push price back toward the previous supply area.
Key levels:
🟢 Support / demand: 83,930–84,100
🟡 Important level: 84,586
🔴 Resistan
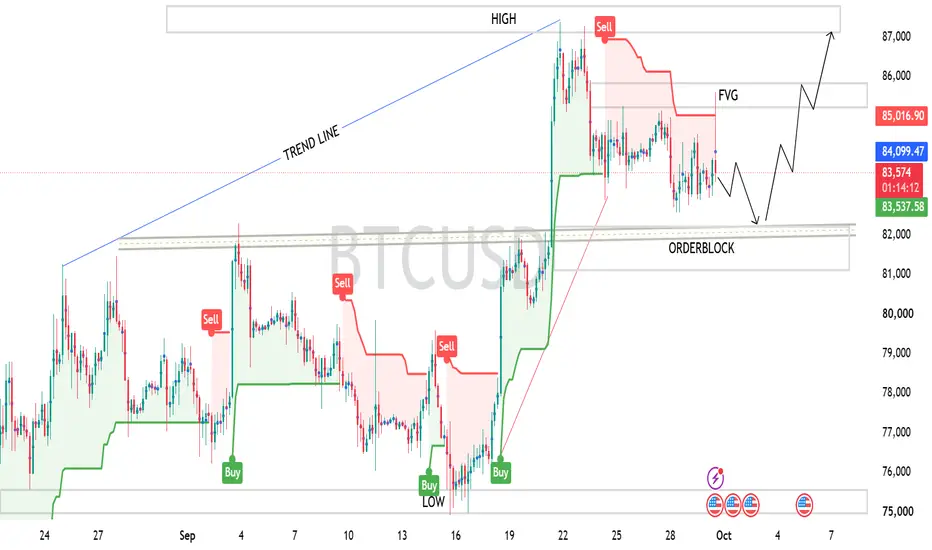
BTCUSD — Technical Market Analysis ## 📊 BTCUSD — Technical Market Analysis
🟢 **Current Price:** ~83,455
📈 **Market Structure:** Bullish on the broader structure, but short-term price is consolidating below resistance.
### 🔍 Key Levels
* 🟥 **Resistance:** 84,000–85,000
* 🟧 **FVG Zone:** ~85,400–86,000
* 🔴 **Major Resistance / High
See all crypto ideas
Intraday AnalysisOption Chain Analysis: Decoding Open Interest (OI) to find where the "Big Players" are positioned.
FII/DII Data: Understanding institutional activity and its impact on market direction.
Intraday Strategies: Scalping and swing setups using Price Action and key EMAs.
Global Market Cues: How GIFT Ni
Gold to go for $4000Gold has already traded down to $4,096 today/recently, while the latest reported intraday range is approximately $4,105–$4,143. Investing.com
My intraday read
Base case: $4,050–$4,170
I would not assume $4,000 immediately. The key is whether gold loses the $4,095–$4,100 zone.
If $4,095 breaks decisi
XAUUSD — 4,100 Demand or 4,180 Supply?
Gold is trading around 4,137 after losing momentum near the 4,180 area. H1 remains bearish below the descending trendline.
Macro News
Gold is under pressure from a firmer U.S. dollar and elevated Treasury yields, while markets await the Fed September meeting minutes for clues on the next rate mov
XAUUSD – The Market Is Still Leaning LowerGold is sitting at an interesting point. The market has been given several reasons to recover, yet every attempt to build upside momentum has remained limited. That disconnect between the headlines and the actual price response is why I still see the short-term balance tilted toward sellers.
Fund
BRIAN XAUUSD – GOLD REBOUNDS FROM BUY POC, BUT 4,165 IS THE REALBRIAN XAUUSD – GOLD REBOUNDS FROM BUY POC, BUT 4,165 IS THE REAL TEST
Gold is showing a short-term recovery after sweeping lower value, but the larger auction is still not fully bullish yet.
Price reacted from the Buy zone POC around 4,109 and is now trading near 4,138. This bounce is important beca
October 8 Gold Market Analysis and Trading Strategy
Gold experienced another wide-range move on Wednesday. Price first broke below 4110 and dropped to around 4065 before rebounding sharply toward 4126, reclaiming the 4110 level and forming a strong V-shaped recovery.
In my view, the most important point is that although gold briefly broke below a
Gold Futures: Wave C May Extend Toward 139,801Gold Futures is showing a corrective structure after the rejection from 164,773, with the current movement appearing to develop as a Wave C of the larger Y correction. The flat formation suggests further downside is still possible before the correction is complete.
The 145,147 area is the first i
XAUUSD 4,100 Is the Trap Zone XAUUSD 4,100 Is the Trap Zone
Gold is still moving inside a clear bearish structure.
The bigger picture is simple: price rejected the upper sellside liquidity around 4,307, then dropped aggressively and kept forming lower highs under the descending trendline. Every recovery attempt has been capped
SILVER VIEW⚠️Education Purpose only!!!!
Key Support area:-87,100
Key Resistance area:-96,200
Silver has long been considered a 🏦 store of value and a 🛡️ hedge against inflation.
Riskier but suitable for speculation and hedging.
🔧 Industrial Demand – Used in ⚡ tech, ☀️ solar, 🚗 EVs
💰 Monetary Hedge – Safe-ha
XAU/USD - Reversal Point, Buyers Take ChanceOANDA:XAUUSD is still trading below the H8 Ichimoku cloud, so the broader correction has not fully reversed yet. However, price is moving closer to the major 3,970–4,073 demand zone, an area that has already produced strong reactions in the past and now becomes the key level for the next bullish s
See all futures ideas
EURUSD 4H ~ Bullish Reaction From Demand ZoneEURUSD has been trading within a clear bearish structure, but price is now approaching a previously respected 4H demand area.
The current setup is based on a potential bullish reaction from this zone. Price has already shown rejection from the lower area and is attempting to establish support aroun
WaveTalks - When EURUSD Tops at 1.20828, Nifty Drops 4,000+ PtsCompliance & Registration Details
Research Analyst Name: Abhishek H Singh Proprietor of WaveTalks
SEBI Registration No: INH000030092
BSE / BASL Enlistment No:7505
Statutory Disclosure:
"Investments in securities market are subject to market risks. Read all the related documents carefully befor
EUR/USD | Sell TradeBased on my analysis, I’m going for a Sell trade in XAU/USD. Here's my executed trade:
Trade Type = TCT A
Entry = 1.12134
SL = 1.12375
TP = 1.11630
Remember :-
* Move your SL to breakeven once the trade reaches 1:1.5 R.
* Aim for a minimum reward of 1:2 R.
* Don't risk more than 2% of your total m
100 on cards for USDINR?Rupee has been trading in the consolidation range of 94-96.70, in the last couple of months. Although the dollar inflows from FCNR(B) were quite robust, the ongoing US-Iran war which keeping the crude at higher levels, higher bond yields across the developed markets and, the lack of hot sectors such
USDCAD – Demand Zone Sparks Bullish ReversalUSDCAD continues to respect a descending channel after completing a strong Wave (3) advance, suggesting the current move is a Wave (4) correction. The currency has tested the lower boundary of the channel near 1.4118, where buyers are attempting to defend support.
Wave (4) occurred near the previou
EURUSD – The Recovery Still Looks FragileFrom both a technical and fundamental perspective, EURUSD still does not give me enough reason to turn bullish. On the H4 chart, the broader structure remains bearish, with price moving inside a descending channel and continuing to form lower highs. Fundamentally, although the US dollar has lost som
GBPAUD TRADEEEHere i have applied MS, LQ, and PROPER RISKMANEGEMENT, SO IM HOPING YOU APPLY YOUR OWN RISKMANAGEMNT HERE, it's a 1:5-6 rr trade, and my stategy have 40-50% win ratio, here also im targeting the liquidity below and waiting for the OB to hit, so with that all of that i have provided this trade, thank
EUR/USD Pushes Deep Into Oversold TerritoryEUR/USD has fallen relentlessly over recent weeks, with the latest leg taking price through an important area of support and pushing daily RSI deep into oversold territory.
Whilst dominant momentum remains bearish, recent price action around the latest lows is beginning to become less one-sided…
See all forex ideas
Trade directly on Supercharts through our supported, fully-verified, and user-reviewed brokers.