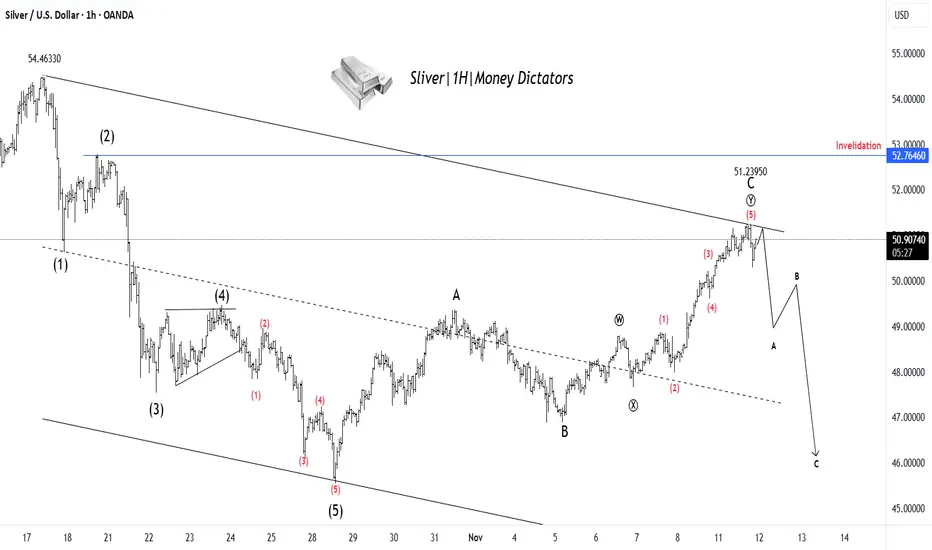
XAG/USD Set for Decline After Finishing Wave YSilver has completed a clear 5-wave upward move, ending near the 51.23 zone, which likely marks the completion of Wave C of the corrective structure. Price action shows rejection from the upper trendline, signaling that buying momentum is fading. This suggests the start of a new A–B–C corrective dec

The best trades require research, then commitment.
Get started for free$0 forever, no credit card needed

Scott "Kidd" PoteetThe unlikely astronaut

Where the world does markets
Join 100 million traders and investors taking the future into their own hands.
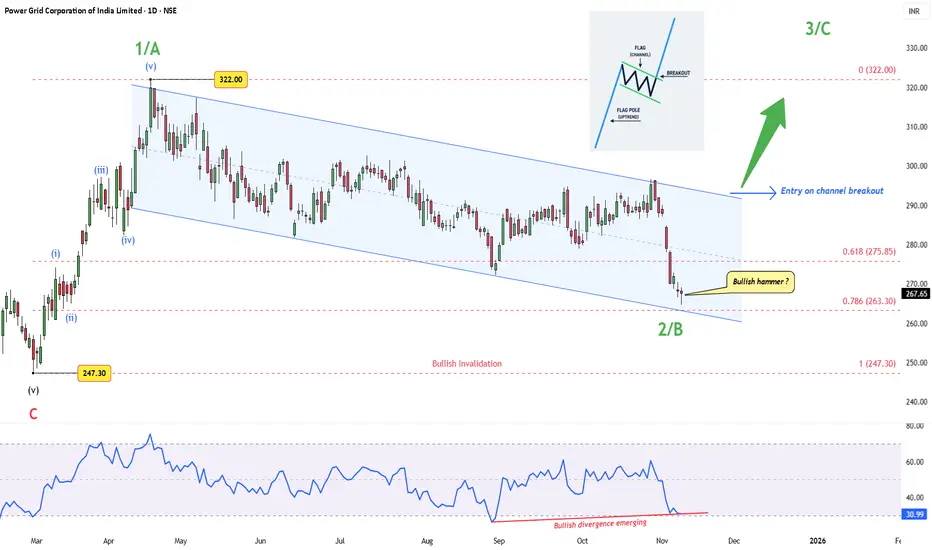
Power Grid – A Flag Within a WaveAfter completing a clean five-wave rally from ₹247.30 to ₹322, Power Grid has spent months in a controlled drift lower — a textbook corrective channel, likely forming Wave 2/B of the next major leg.
Price now sits near the 0.786 retracement (₹263 zone), showing early signs of exhaustion. A “ Bullis
Breakout retesting apollo HospitalBest ever result
ATH breakout & re-testing
Price should start new rally.
Price should not break the strong support of 7500
This is only for educational purpose no any trade recommendation

SAIL : LongTrend: The stock is forming a cup and handle pattern, which is a bullish continuation setup. It has broken out above the neckline around 140 levels, showing strength. The trend has turned positive after a long consolidation phase.
Volume: There is a clear increase in volume during the breakout, whi

Bajaj Finserv: Resistance Breaks, Q2 Results Await🔍 Technical Analysis
Bajaj Finserv Limited has delivered an impressive super bullish rally since 2010, establishing itself as a blue-chip financial services stock. Multiple times since 2021, the stock faced resistance at the ₹2,000 level, which acted as a psychological and technical barrier.
Howe

Crompton | A Reversal Imminent?DISCLAIMER: This idea is NOT a trade recommendation but only my observation. Please take your trades based on your own analysis.
Points to note:
-----------------
1. RSI shows a bullish divergence with price.
2. The rejection of selling comes inside a Weekly Demand zone.
3. The high volume inside

Sobha- A breakout of consolidation is on cardsRealty sector has been performing well post Q2 results announcements.
Sobha has posted stellar Q2 numbers but it might be one off quarter as well.
Technically, stock is looking ripe for a good flag breakout of consolidation.
We might soon see a breakout coming but sustainment of breakout is crucial

Sambhv Steel Tubes cmp 121.45 by the Daily Chart since listedSambhv Steel Tubes cmp 121.45 by the Daily Chart since listed
- Support Zone 107 to 116 Price Band
- Breakout done from the Falling Price Channel
- Rising Price Channel taking upside momentum
- Volumes gradually picking up indicating continued uptrend
- Resistance Zone 125 to 135 Price Band then 1

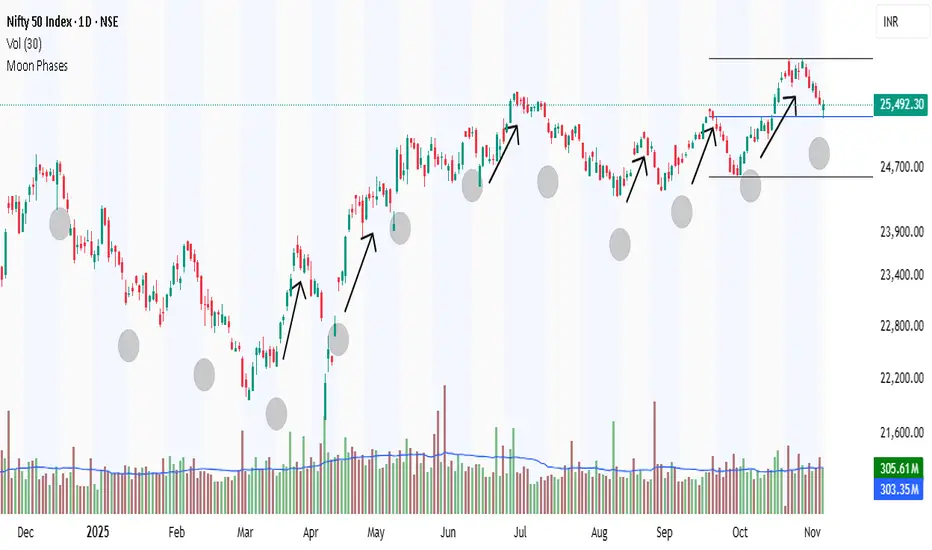
The Moon's phases are the changing mode (NIFTY)The Moon's phases are the changing shapes of the Moon's illuminated portion as seen from Earth, caused by its orbit around our planet. The Sun always lights half of the Moon, but our view of that lit half varies over a cycle lasting about 29.5 days (a synodic month). There are eight primary phases,
IDBI Bank and the Bullish Cup & Handle Pattern📈 Technical Analysis Spotlight: IDBI Bank and the Bullish Cup & Handle Pattern
In the world of technical analysis, chart patterns often serve as powerful indicators of potential price movements. One such pattern, the Cup and Handle, has recently emerged on the daily chart of IDBI Bank Limited, offer

See all editors' picks ideas
PriceFormatLibrary for automatically converting price values to formatted strings
matching the same format that TradingView uses to display open/high/low/close prices on the chart.
█ OVERVIEW
This library is intended for Pine Coders who are authors of scripts that display numbers onto a user's charts. T

LogNormalLibrary "LogNormal"
A collection of functions used to model skewed distributions as log-normal.
Prices are commonly modeled using log-normal distributions (ie. Black-Scholes) because they exhibit multiplicative changes with long tails; skewed exponential growth and high variance. This approach i

Range Oscillator (Zeiierman)█ Overview
Range Oscillator (Zeiierman) is a dynamic market oscillator designed to visualize how far the price is trading relative to its equilibrium range. Instead of relying on traditional overbought/oversold thresholds, it uses adaptive range detection and heatmap coloring to reveal where pri

Volume Surprise [LuxAlgo]The Volume Surprise tool displays the trading volume alongside the expected volume at that time, allowing users to spot unexpected trading activity on the chart easily.
The tool includes an extrapolation of the estimated volume for future periods, allowing forecasting future trading activity.
🔶 U

Smooth Theil-SenI wanted to build a Theil-Sen estimator that could run on more than one bar and produce smoother output than the standard implementation. Theil-Sen regression is a non-parametric method that calculates the median slope between all pairs of points in your dataset, which makes it extremely robust to o

Fair Value Gaps by DGTFair Value Gaps
A refined, multi-timeframe Fair Value Gap (FVG) detection tool that brings institutional imbalance zones to life directly on your chart.
Designed for precision, it visualizes how price delivers into inefficiencies across chart, higher, and lower (intrabar) timeframes — offering a fl

TASC 2025.11 The Points and Line Chart█ OVERVIEW
This script implements the Points and Line Chart described by Mohamed Ashraf Mahfouz and Mohamed Meregy in the November 2025 edition of the TASC Traders' Tips , "Efficient Display of Irregular Time Series”. This novel chart type interprets regular time series chart data to create an ir

Simplified Percentile ClusteringSimplified Percentile Clustering (SPC) is a clustering system for trend regime analysis.
Instead of relying on heavy iterative algorithms such as k-means, SPC takes a deterministic approach: it uses percentiles and running averages to form cluster centers directly from the data, producing smoo

Adaptive Volume Delta Map---
📊 Adaptive Volume Delta Map (AVDM)
What is Adaptive Volume Delta Map (AVDM)?
The Adaptive Volume Delta Map (AVDM) is a smart, multi-timeframe indicator that visualizes buy and sell volume imbalances directly on the chart.
It adapts automatically to the best available data resolution

Dynamic Equity Allocation Model"Cash is Trash"? Not Always. Here's Why Science Beats Guesswork.
Every retail trader knows the frustration: you draw support and resistance lines, you spot patterns, you follow market gurus on social media—and still, when the next bear market hits, your portfolio bleeds red. Meanwhile, institution

See all indicators and strategies
Community trends
Power Grid – A Flag Within a WaveAfter completing a clean five-wave rally from ₹247.30 to ₹322, Power Grid has spent months in a controlled drift lower — a textbook corrective channel, likely forming Wave 2/B of the next major leg.
Price now sits near the 0.786 retracement (₹263 zone), showing early signs of exhaustion. A “ Bullis
Persistent Buyers dominance as seen in the chart institutions are interested in the upside.
Fib price for bulls 6027.

Unlocking Chart Vision: Why One Breakout Isn’t EnoughRetail traders often gravitate towards the familiar—you’ll notice on the right chart, a classic breakout above the counter trendline (CT) is the “go-to” setup most focus on. This approach is common, but it can signal limited experience or a lack of exposure to complex, multi-pattern scenarios.
As a

Maruti: A good short term opportunity setting upHello,
Maruti Suzuki India Ltd, a subsidiary of Suzuki Motor Corp. The company is engaged in the manufacturing, purchase, and sale of motor vehicles, components, and spare parts. Its other activities include the facilitation of pre-owned car sales, fleet management, and car financing.
Maruti stoc

BUY TODAY SELL TOMORROW for 5%DON’T HAVE TIME TO MANAGE YOUR TRADES?
- Take BTST trades at 3:25 pm every day
- Try to exit by taking 4-7% profit of each trade
- SL can also be maintained as closing below the low of the breakout candle
Now, why do I prefer BTST over swing trades? The primary reason is that I have observed that

TCS 1 Month Time Frame 📊 1-Month Price Overview
On ~12 Nov 2025, TCS was trading at around ₹3,116.
Over the past month, highs in the ~₹3,120 range and lows around ~₹2,943.10 were observed.
The 1-month return is modest: about +2.9% according to one source.
Volatility: According to sector data, the beta over the last mon

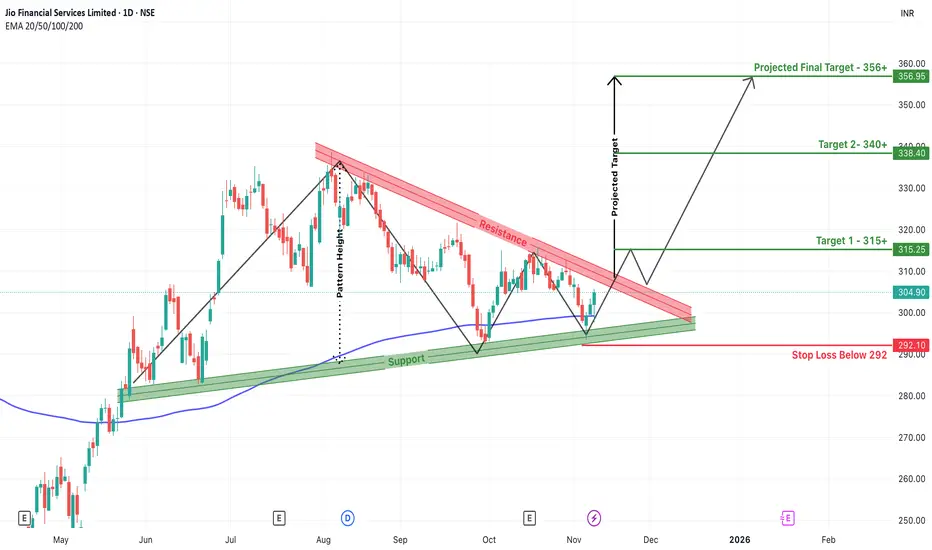
Jio Financial Breakout Watch –Wedge Setup Points to ₹356+ TargetJio Financial Services is currently presenting an exciting opportunity on the charts, with a wedge breakout setup forming after months of consolidation. A wedge is a bullish pattern that typically signals a reversal or continuation of an uptrend, especially when supported by rising volumes and stron
Hindustan Aeronautics Limited – Technical Chart Analysis Hindustan Aeronautics Limited (HAL) – Technical Chart Analysis
Hindustan Aeronautics Limited (HAL) is currently trading around ₹4,763, showing a mild correction of about 2.04% for the day.
The stock continues to be in focus as the defence budget and government initiatives t

COLPAL | Selling exhausted?DISCLAIMER: This idea is NOT a trade recommendation but only my observation. Please take your trades based on your own analysis.
Points to note:
-----------------
1. RSI shows a bullish divergence with price.
2. The rejection of selling comes inside a Demand zone.
-----------------
A trade can be

Biocon Approaching Breakout Zone – Sustaining Above ₹405 Technical Overview
The stock is trading near a crucial resistance zone at ₹405, which has historically acted as a supply area multiple time.
Currently, price is above the 9-day EMA and 20-day EMA, indicating strong bullish momentum and short-term trend alignment.
Volumes have shown a steady ri

See all stocks ideas
Tomorrow
UFLEXUFlex Limited
Actual
—
Estimate
—
Tomorrow
AKUMSAkums Drugs and Pharmaceuticals Limited
Actual
—
Estimate
—
Tomorrow
ORIENTPPROrient Paper & Industries Ltd.
Actual
—
Estimate
—
Tomorrow
SHALBYShalby Ltd.
Actual
—
Estimate
—
Tomorrow
INFIBEAMInfibeam Avenues Ltd.
Actual
—
Estimate
0.20
INR
Tomorrow
FOODSINFoods & Inns Ltd.
Actual
—
Estimate
—
Tomorrow
RELAXORelaxo Footwears Limited
Actual
—
Estimate
1.73
INR
Tomorrow
SANDHARSandhar Technologies Ltd.
Actual
—
Estimate
—
See more events
Community trends
ETHUSDT/BTCUSDT Short idea 11/11/2025Wassup Lads!
This looks like a very enticing short setup simply because
1. Price in a daily bearish fair value gap
2. We have SMT Divergence between BTC and ETH on the daily time frame
Switching over to the H1 time frame I'm clearly seeing price print out a bearish orderflow, I have not yet entere

BTCUSDBitcoin is in a downtrend.
Currently falling off the supply zone, @106 lvl.
Will be monitoring closely the demand, other then that first low is logical target.

BTC 8R Sell scenario.........BTC is in downtrend in daily timeframe and shown sniper delivery, now it is in pullback mode. We may anticipate a good short term trade on hourly time frame around hourly FVG
1. HTF MSS is already done and price is reverting to FVG after BOS.
2. Daily quadrant cluster is also falling around FVG.

Breaking: XRP ETF to Launch on Nasdaq TomorrowBreaking: XRP ETF to Launch on Nasdaq Tomorrow
Big news for the CRYPTOCAP:XRP community!
Canary Capital has officially filed to list the first-ever Spot #XRPETF on the Nasdaq, trading under the ticker XRPC. If all goes as expected, trading could begin tomorrow.
This ETF will let U.S. investors g

BTC current week update and explanation BTC is still inside a short-term downtrend but is showing signs of base formation / potential reversal.
BTC has lower highs and lower lows = still technically bearish.
EMA 20 ≈ slightly below EMA 50 → still bearish crossover. But candles are hovering near the EMAs, meaning bearish momentum is weak

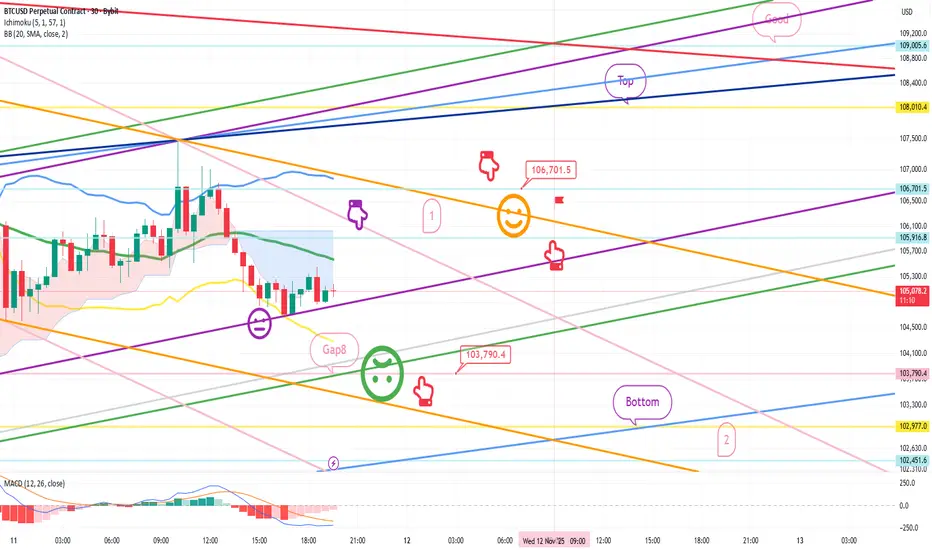
Bitcoin Bybit chart analysis November 11Hello
It's a Bitcoin Guide.
If you "follow"
You can receive real-time movement paths and comment notifications on major sections.
If my analysis was helpful,
Please click the booster button at the bottom.
This is a Bitcoin 30-minute chart.
There are no separate Nasdaq indicators.
I developed a
DOTUSDT_Short Elliot WaveI'm anticipating DOT to move toward the $3 level, so a potential short position could be considered around $3.30. Make sure to do your own research before taking any trade.


“ETH Correction Path: Fall → Trap → Collapse → Rebirth”
🧠 ETH Big Picture Analysis | Multi-Leg Correction Ahead
Current Price: ~$3400
Ethereum appears to be setting up for a deeper corrective structure. From the current levels around $3400, I expect ETH to drop toward $2200, completing the first major leg down.
After that, a strong relief bounce coul

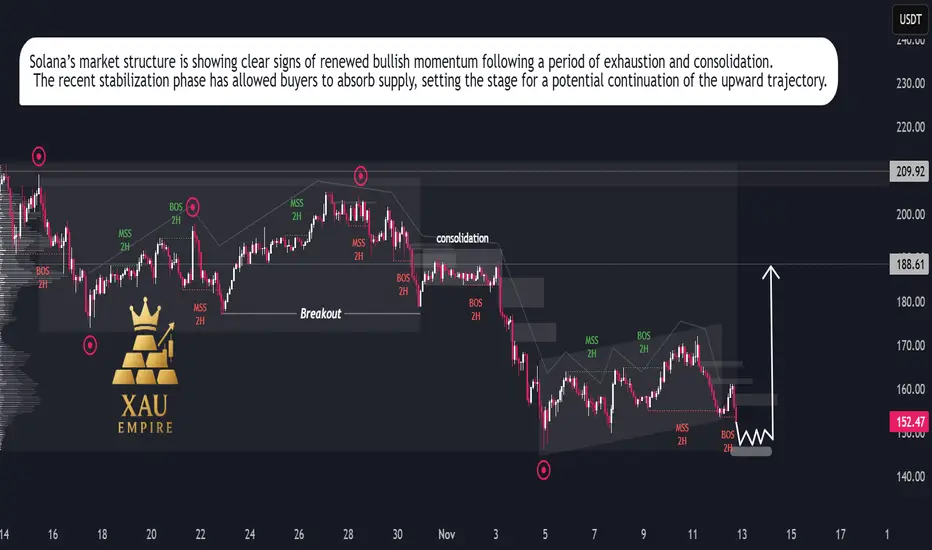
SOL/USDT – Bullish Momentum Rising, Rally Setup in ProgressSolana is showing renewed strength after an extended corrective phase, suggesting that the recent slowdown was a temporary reaccumulation rather than the start of a new downtrend. Price action has begun to stabilize, reflecting growing investor confidence and increasing participation from buyers at
See all crypto ideas
GOLD LOSES MOMENTUM – BUYERS PAUSE AHEAD OF CPI STORM1️⃣ CONTEXT & PREVIOUS SESSION DEVELOPMENTS
On 11/11, gold surged to the 4,149 region, but was rejected at the H4 liquidity peak + D1 OB, indicating that short-term buying power has started to weaken.
By this morning (12/11), prices consistently formed Lower Highs on H1, showing that adjustment pre

XAG/USD Set for Decline After Finishing Wave YSilver has completed a clear 5-wave upward move, ending near the 51.23 zone, which likely marks the completion of Wave C of the corrective structure. Price action shows rejection from the upper trendline, signaling that buying momentum is fading. This suggests the start of a new A–B–C corrective dec
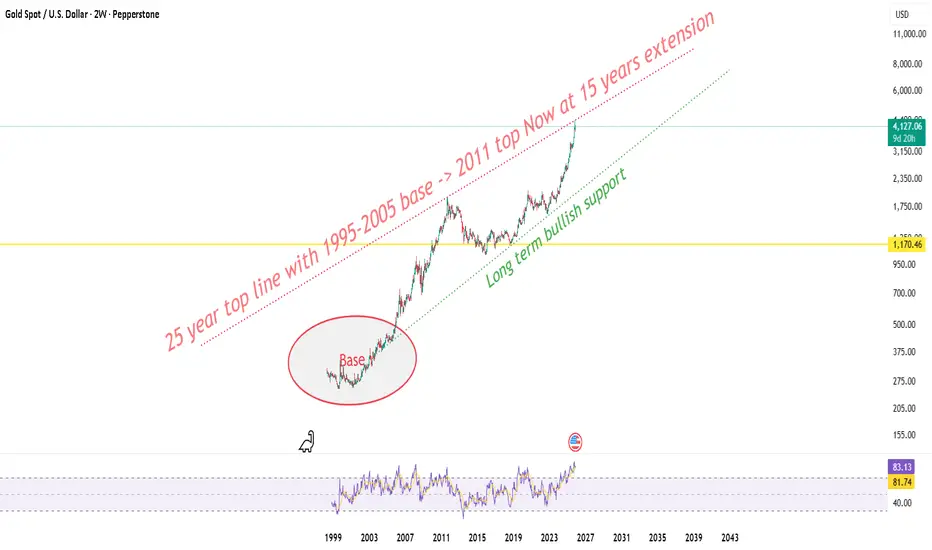
Gold at 25 year top line ! Macro view !Zooming out to the 2 week frame gold’s now touching the same top line that was drawn from the 1995-2005 base to the 2011 cycle high. This upper rail has acted like a generational ceiling and after nearly 15 years, price has stretched back into that very band again, this time near 4150–4350.
Thi
Gold to make one final pushGold is falling today, but probably in wave iv of C. Gold is bouncing back in ABC or three waves inside an X wave or a counter-trend bounce. This should be the final push toward the 61.8% retracement mark near 4192. Some people want me to use hourly charts and mark the end hurriedly. Even on the hou

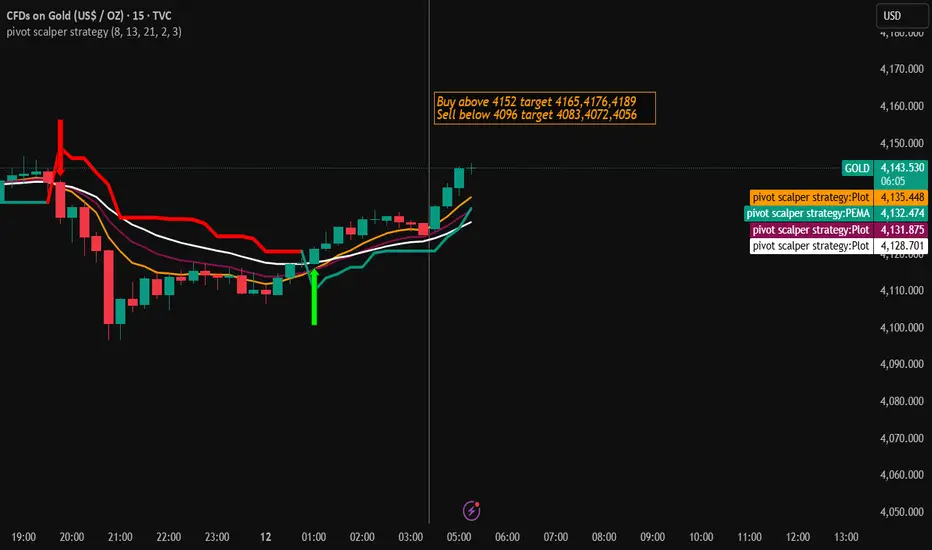
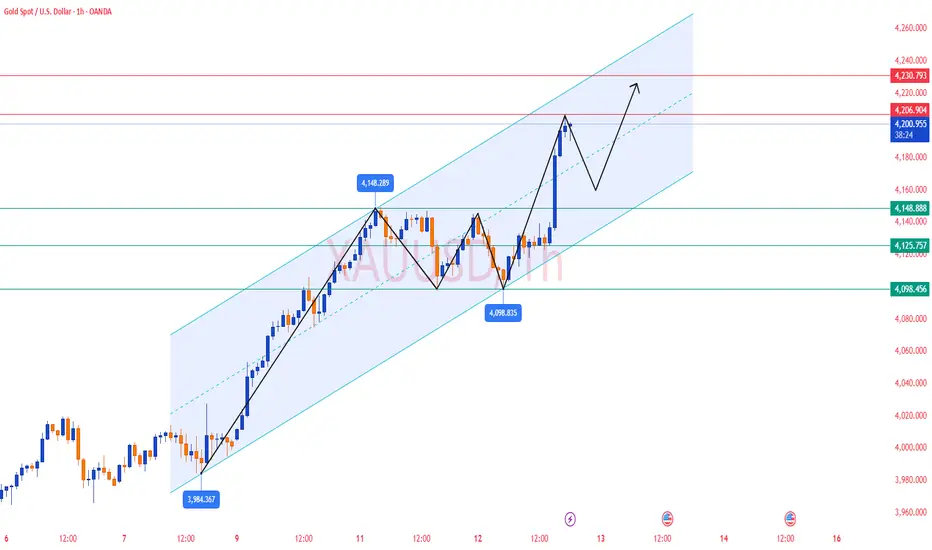
Gold Trading Strategy for 12th November 2025🪙 GOLD Trading Setup (Intraday Strategy)
📈 Buy Setup (Bullish Scenario)
👉 Condition to Enter Buy:
Wait for the 1-hour candle to close above $4152.
This confirms bullish momentum (buyers are taking control).
🎯 Targets after Buy Entry:
Target 1: $4165
Target 2: $4176
Target 3: $4189
🛑 Stop Loss (SL)
WTI Crude Oil 4H Analysis | Potential Long SetupAfter a prolonged downtrend inside a descending channel, Crude Oil has broken out and is now consolidating near the 0.5 Fibonacci retracement level.
🔹 Buying Zone 1: 59.30 – 58.80
🔹 Buying Zone 2: 57.40 – 56.70
🔹 Stop Loss (SL): Below 55.90
🔹 Target (TGT): 66.40
Technical Outlook:
The price is re

NATURALGAS - Approaching Harmonic CRAB PRZ (Short Term)
TF: 15 Minutes
CMP: 4.6464
Please note that this view is ONLY for the short term as the TF is 15 minutes. So plan your trade accordingly.
The ideal pattern target for the PRZ is 1.618 fib extension (of the XA leg) at 4.7740 and we should be expecting at least 50% pullback from that level.
If you

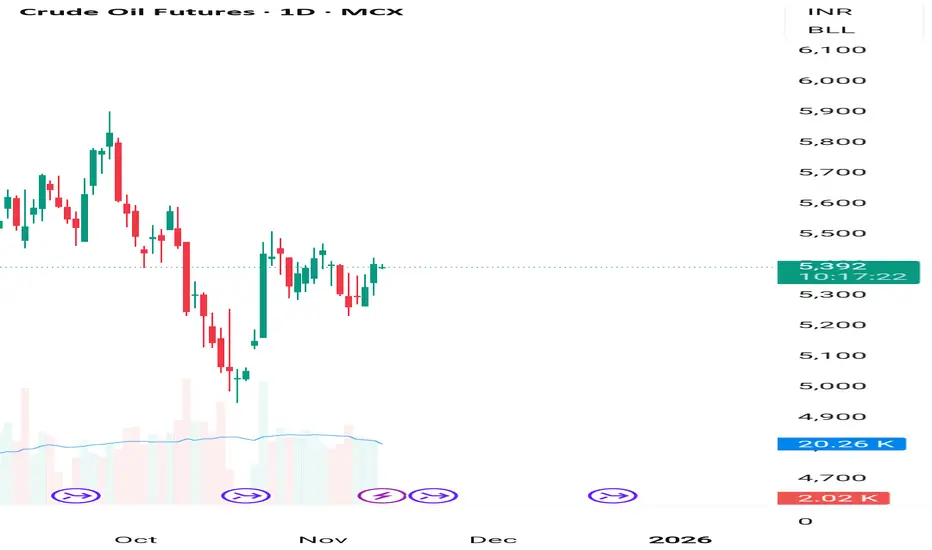
Crude oil AI tool showing unmove will continue until 5300 break 🔑 Key Highlights
- Price Action: Crude is holding firm above ₹5,350, showing renewed bullish momentum.
- Trend: Long Build‑Up (Price↑ + OI↑), indicating fresh long positions.
- Supports: ₹5,350 / ₹5,300 / ₹5,250.
- Resistances: ₹5,420 / ₹5,480 / ₹5,550.
- Bias: Bullish continuation if ₹5,350
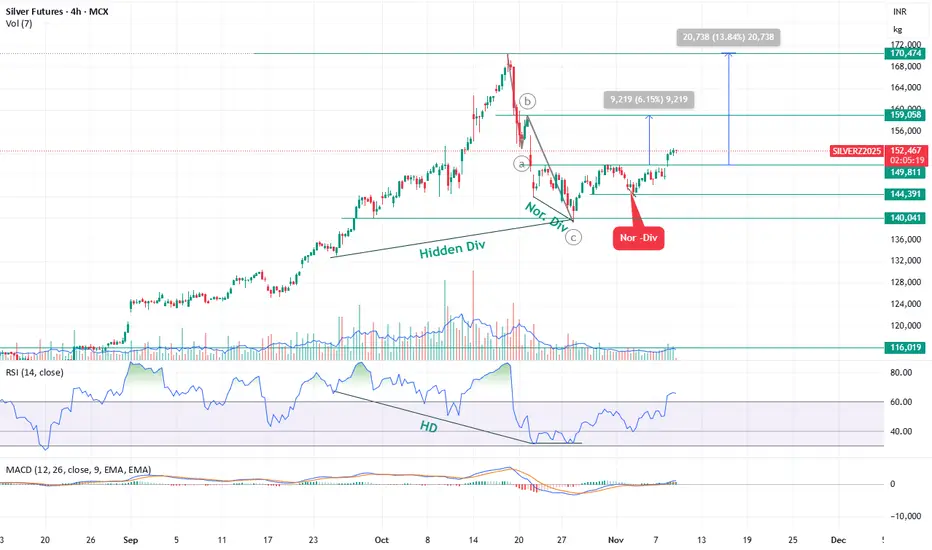
Bullish — Silver bounce expected toward ₹1,59,000 and ₹1,72,000 Silver Futures (SILVERZ2025 – 4H Chart) Technical Outlook
Elliott Wave Structure & Current Setup
Silver is currently trading in Wave 4, and the corrective phase appears to be complete.
Silver has completed its Wave 4 correction and has started a new impulsive leg (Wave 5).
A breakout above ₹1,50,0
Gold Analysis and Trading Strategy | November 12-13✅From the 4H chart, gold surged sharply to a high of 4206.57 before experiencing a strong pullback, forming a long upper shadow. This indicates that bullish momentum weakened after testing resistance around the upper Bollinger Band (4203.88).
The current price is trading around 4190–4195, slightly
See all futures ideas
NZD CAD ShortThis idea is for educational purpose only , this is not a recommendation of buy or sell ,

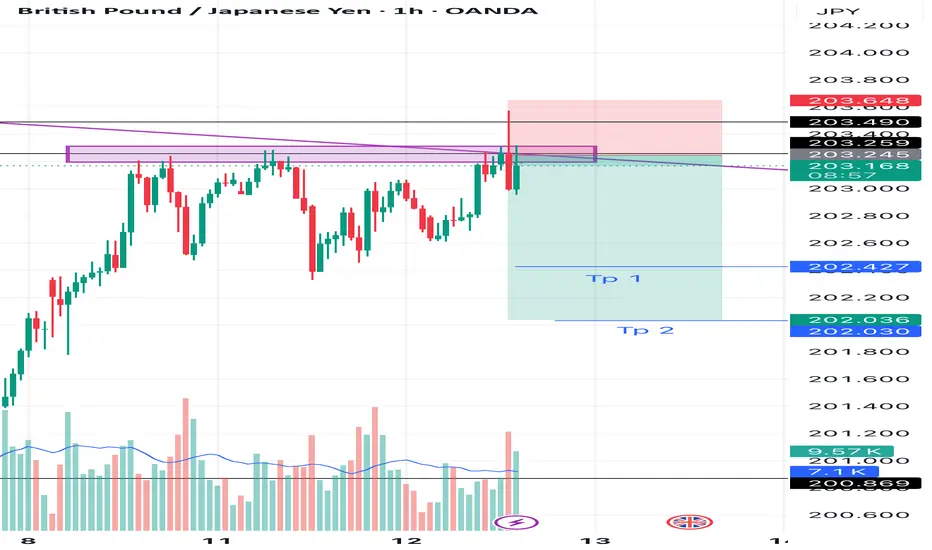
GBPJPY SHORT 1H TIME FRAME I am sitting in short of GBPJPY on 1H Time frame
Logic :- i can clearly see a good rejection with huge volumes from resistance and buyers are trapped, Sellers are gaining control so i am going for 1:2/3.
Let’s see one can take with proper SL gand targets given ✅
Trust the process 🚀, A lot more to
GBPJPY MULTI TIMEFRAME ANALYSIS Hello traders , here is the full multi time frame analysis for this pair, let me know in the comment section below if you have any questions , the entry will be taken only if all rules of the strategies will be satisfied. wait for more price action to develop before taking any position. I suggest yo

EURAUDBuys are valid on EA,
Structure is bullis and price mitigated the demand zone.
Let's see if buyers will step in once again.

USD-JPY is in a Bullish PatternUSD-JPY is about to Break the Pattern . In 30 Min TF it is Trading in in a FLAT-TOP pattern and also it shows a Flag & Pole pattern and Both are Bullish Patterns . This type of pattern may give the Breakout on either side.

AUDNZD - OVERBOUGHT CONDITIONS HINTING AT A POSSIBLE REVERSALSymbol - AUDNZD
CMP - 1.1485
AUDNZD continues to maintain its upward trajectory, supported by fundamental divergence between the two economies. The Australian dollar remains resilient and continues to outperform the New Zealand dollar after the RBNZ implemented an aggressive 50 basis point rate cu

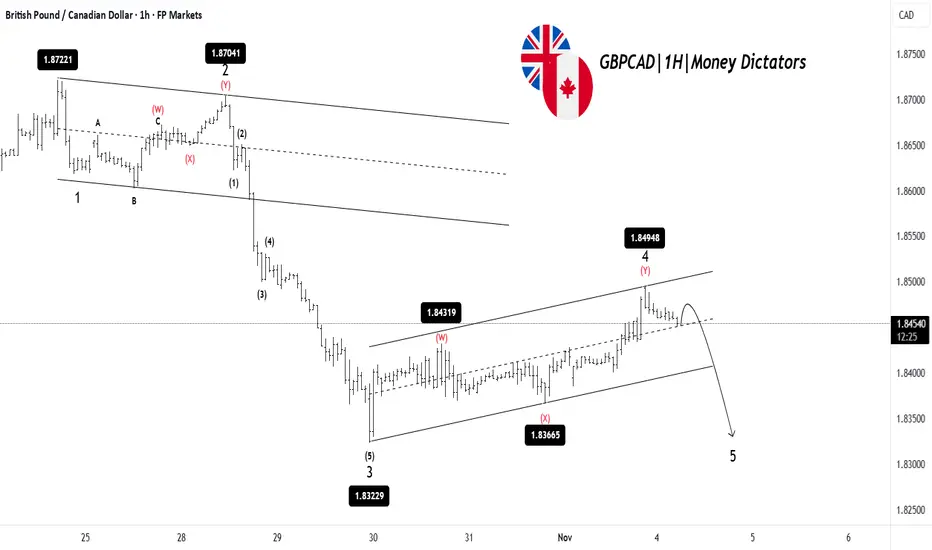
GBPCAD: Bears Ready to Push Into Wave 5GBPCAD has completed a clear 1-2-3 move to the downside, followed by a corrective Wave 4 that has pushed the price higher inside a rising channel. This correction now looks nearly complete, as the price is struggling to break above the resistance. Once Wave 4 is finished, the chart suggests a final

EURUSD – Bullish Setup Toward 1.16EURUSD – Bullish Setup Toward 1.17
EURUSD is showing strong signs of a bullish reversal after an extended period of downside movement. The 3H chart highlights several Market Structure Shifts (MSS) and Breaks of Structure (BOS) suggesting that bearish momentum is fading and buyers are regaining cont

EUR/USD I think EUR/USD Market Target 1.16250 Level in the DXY Weakness Situation and EXY Strong Situation.

See all forex ideas
| - | - | - | - | - | - | - | - | ||
| - | - | - | - | - | - | - | - | ||
| - | - | - | - | - | - | - | - | ||
| - | - | - | - | - | - | - | - | ||
| - | - | - | - | - | - | - | - | ||
| - | - | - | - | - | - | - | - | ||
| - | - | - | - | - | - | - | - | ||
| - | - | - | - | - | - | - | - | ||
| - | - | - | - | - | - | - | - |
Trade directly on the supercharts through our supported, fully-verified and user-reviewed brokers.


