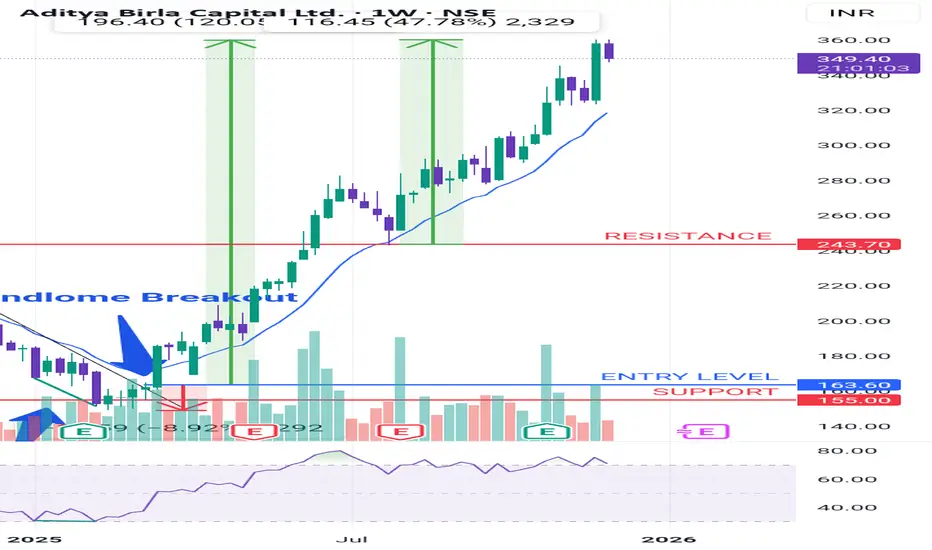
In weekly chart of ABCAPITAL there was RSI Divergence in first quarter of Year 2025. It made a Trendline Breakout in second week of March 2025
And gave entry above breakout candle weekly close at 163.6 and then with a risk of 9% it gave one sided returns of Risk:Reward of 1:13
Curent Return at 120%
It retested resistance level of 243.7 which corresponded 21-EMA in july 2025 and again gave return of 45% from the resistance level
It is again forming a Bearish RSI Divergence. But bullish trend is intact till it gives a weekly close below 21-EMA
Disclaimer
The information and publications are not meant to be, and do not constitute, financial, investment, trading, or other types of advice or recommendations supplied or endorsed by TradingView. Read more in the Terms of Use.
Disclaimer
The information and publications are not meant to be, and do not constitute, financial, investment, trading, or other types of advice or recommendations supplied or endorsed by TradingView. Read more in the Terms of Use.