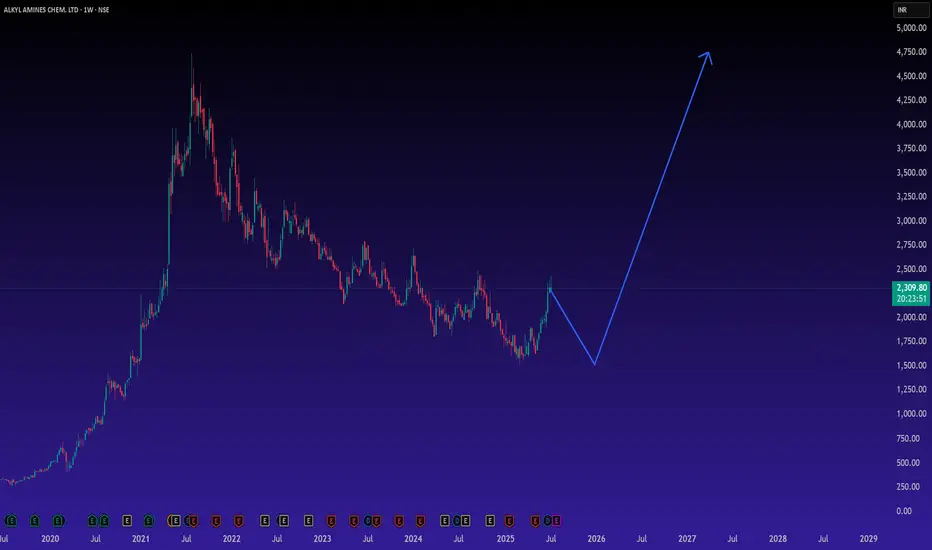
This chart of Alkyl Amines Chemicals Ltd (NSE: ALKYLAMINE) on the weekly timeframe shows a textbook channel breakdown followed by a potential trend reversal setup.
📈 Chart Analysis (ALKYLAMINE | Weekly Timeframe)
⚠️ Disclaimer:
This is not investment advice. The analysis shared here is purely for educational purposes. Please do your own research or consult a registered financial advisor before making any investment decisions.
📈 Chart Analysis (ALKYLAMINE | Weekly Timeframe)
- Massive Rally (2020–2021): The stock saw a parabolic rise during the pandemic, peaking near ₹4,700 in early 2021.
- Prolonged Correction (2021–2024): A multi-year downtrend followed, forming a falling channel with lower highs and lower lows.
- Potential Reversal Zone: The stock seems to have broken out of the downward channel recently and has started forming higher lows, indicating accumulation and strength returning.
- Short-Term Pullback Likely: Based on the projected path on the chart, a healthy correction or retest might occur before a major impulsive wave begins.
- Medium-to-Long-Term Projection: A VCP-type structure (Volatility Contraction Pattern) or cup-and-handle base could be forming with targets much higher in the next 2–3 years if the current support holds.
⚠️ Disclaimer:
This is not investment advice. The analysis shared here is purely for educational purposes. Please do your own research or consult a registered financial advisor before making any investment decisions.
Disclaimer
The information and publications are not meant to be, and do not constitute, financial, investment, trading, or other types of advice or recommendations supplied or endorsed by TradingView. Read more in the Terms of Use.
Disclaimer
The information and publications are not meant to be, and do not constitute, financial, investment, trading, or other types of advice or recommendations supplied or endorsed by TradingView. Read more in the Terms of Use.