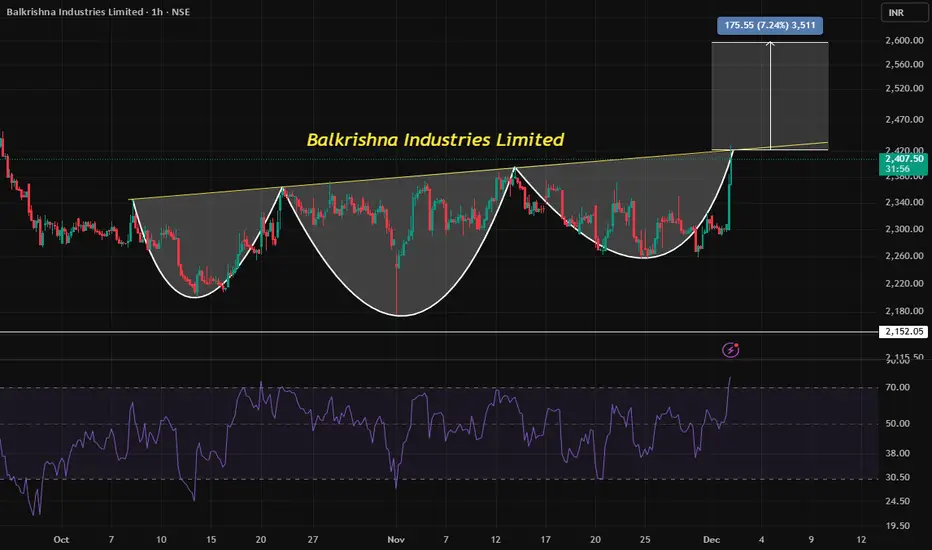
📊 Understanding the Head & Shoulder Pattern
Definition: The Head & Shoulder (H&S) pattern is one of the most recognized reversal formations in technical analysis. It consists of three peaks:
Left Shoulder: A rise followed by a decline.
Head: A higher rise followed by another decline.
Right Shoulder: A smaller rise, often mirroring the left shoulder, followed by a decline.
Neckline: The support level connecting the lows after each peak. A breakdown below this line often signals a bearish reversal.
👉 Why it matters: Traders view the H&S as a warning that bullish momentum is fading and a potential trend reversal could be underway.
⚡ RSI Momentum Explained
Relative Strength Index (RSI): A momentum oscillator that measures the speed and change of price movements.
Key Levels:
Above 70 → Overbought zone (possible correction or reversal).
Below 30 → Oversold zone (possible bounce).
In Balkrishna Industries’ case, RSI moving above 70 on the hourly chart suggests the stock is in an overbought condition, increasing the probability of a pullback.
📌 Current Opportunity in Balkrishna Industries (Trading at 2407)
The stock is forming a Head & Shoulder pattern on the hourly timeframe.
RSI above 70 indicates overheated momentum, aligning with the potential reversal signal from the H&S.
Trader’s takeaway:
Watch for a neckline breakdown to confirm the pattern.
A confirmed breakdown could open opportunities for short trades or profit booking.
Risk management is crucial—false breakouts can occur, so traders often wait for volume confirmation.
🎯 Why Traders Should Care
Combining chart patterns (H&S) with momentum indicators (RSI) gives a stronger signal than relying on one alone.
Balkrishna Industries at 2407 is at a critical juncture—either it sustains momentum or confirms reversal.
For traders, this is a classic setup where technical analysis provides a roadmap for potential profit opportunities.
🔥 In short: "Balkrishna Industries is shouting reversal—will you listen to the charts?"
Disclaimer
The information and publications are not meant to be, and do not constitute, financial, investment, trading, or other types of advice or recommendations supplied or endorsed by TradingView. Read more in the Terms of Use.
Disclaimer
The information and publications are not meant to be, and do not constitute, financial, investment, trading, or other types of advice or recommendations supplied or endorsed by TradingView. Read more in the Terms of Use.