📘 BANK NIFTY – TRADING PLAN for 02-Jun-2025
🕒 Timeframe: 15-minute Chart Structure
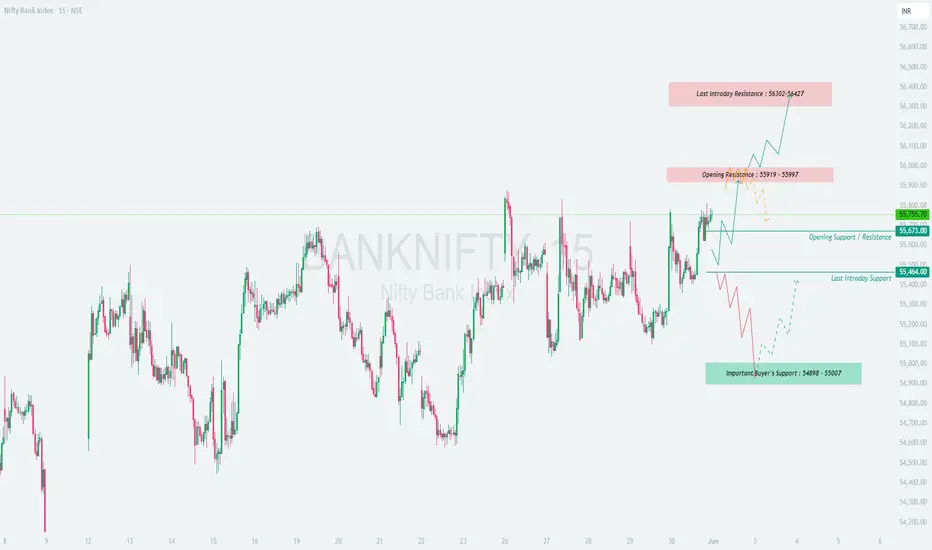
📍 Gap Opening Threshold: 200+ points from previous close of 55,755.70
🕒 Timeframe: 15-minute Chart Structure
📍 Gap Opening Threshold: 200+ points from previous close of 55,755.70
- 🔼 GAP-UP OPENING (Above 55,997):
If Bank Nifty opens above the Opening Resistance zone (55,919 – 55,997), the bulls will hold an early advantage. This signals potential breakout strength, but traders must stay cautious of the Last Intraday Resistance (56,302 – 56,427).
✅ Plan of Action:
• If the opening candle sustains above 55,997, look for bullish price action confirmation (e.g., a strong green candle with follow-through).
• Go long above 55,997 targeting:
→ 56,302 (first resistance)
→ 56,427 (profit-booking zone)
• Stop-loss can be placed just below the breakout candle low or under 55,919 zone.
• Be cautious of exhaustion near 56,302–56,427; if prices spike too fast, avoid fresh longs and wait for pullback/retest.
🧠 Educational Tip: Gap-up breakouts often trap late buyers. Ensure breakout is supported by volume and structure; look for follow-through candles before entering trades.
- ⚖️ FLAT OPENING (Between 55,673 – 55,919):
A flat open in this neutral zone keeps both breakout and breakdown scenarios alive. The price is likely to consolidate or form a directional move after the first 15–30 minutes.
✅ Plan of Action:
• Watch the upper resistance at 55,919 – 55,997 and lower support near 55,673 – 55,464.
• A break and close above 55,997 can initiate a breakout rally (as discussed above).
• A break and close below 55,673 may lead to a test of lower supports:
→ 55,464 (Last Intraday Support)
→ 55,007 – 54,898 (Major Buyer’s Support Zone)
• Avoid trading within the 55,673–55,919 range unless a clear structure forms (like bullish/bearish engulfing or rejection wicks).
🧠 Educational Tip: During flat openings, most whipsaws occur. Patience is your biggest edge. Let market participants reveal their intent before committing to a direction.
- 🔽 GAP-DOWN OPENING (Below 55,464):
If Bank Nifty opens more than 200 points lower and breaches the 55,464 level, it signals immediate weakness. Bears may attempt to drag prices down to the strong demand zone at 54,898 – 55,007.
✅ Plan of Action:
• Observe how price reacts at 55,007 – 54,898:
→ If strong bullish reversal candles appear (hammer, bullish engulfing), a long reversal trade may be attempted toward:
• 55,464** (first resistance)
→ If the zone is breached, bearish momentum may accelerate toward deeper levels.
• For aggressive shorts, look for confirmation with a bearish candle below 54,898, targeting lower levels intraday (use tight stop-loss).
• Avoid emotional entries at the open; wait 15–30 mins for structure clarity.
🧠 Educational Tip: Demand zones are best traded on confirmation, not anticipation. Look for price rejection and structure. Don’t catch falling knives without confirmation.
🛡 RISK MANAGEMENT TIPS FOR OPTIONS TRADERS:
✅ Avoid buying far OTM options post-gap openings; stick with near ATM options or spreads.
✅ Use spreads like bull call/bear put spreads to control theta decay, especially if price stalls after the move.
✅ Stick to defined risk per trade (e.g., 1–2% of capital) and don’t double down on losing positions.
✅ Avoid revenge trading if the first trade fails; instead, reassess structure and re-enter only on confirmation.
✅ Always respect stop-loss based on 15-min close, not just spikes or volatility wicks.
📊 SUMMARY & CONCLUSION:
• 🟢 Bullish Scenario: Above 55,997 → Targets: 56,302 / 56,427
• 🔴 Bearish Scenario: Below 55,464 → Targets: 55,007 / 54,898
• 🟧 Neutral Zone: 55,673 – 55,919 → Wait for breakout or breakdown
• 🟩 Support Levels: 55,673 / 55,464 / 54,898
• 🟥 Resistance Levels: 55,919 / 55,997 / 56,427
• 🧠 Key Strategy: Let the first 15–30 minutes unfold. Follow price structure and risk management, not emotions.
✨ Final Word: The best trades come from waiting. Let the chart confirm your bias and stick to your plan.
📢 DISCLAIMER: I am not a SEBI-registered analyst. This trading plan is for educational purposes only. Please consult with a SEBI-registered financial advisor before making any trading or investment decisions.
Disclaimer
The information and publications are not meant to be, and do not constitute, financial, investment, trading, or other types of advice or recommendations supplied or endorsed by TradingView. Read more in the Terms of Use.
Disclaimer
The information and publications are not meant to be, and do not constitute, financial, investment, trading, or other types of advice or recommendations supplied or endorsed by TradingView. Read more in the Terms of Use.