
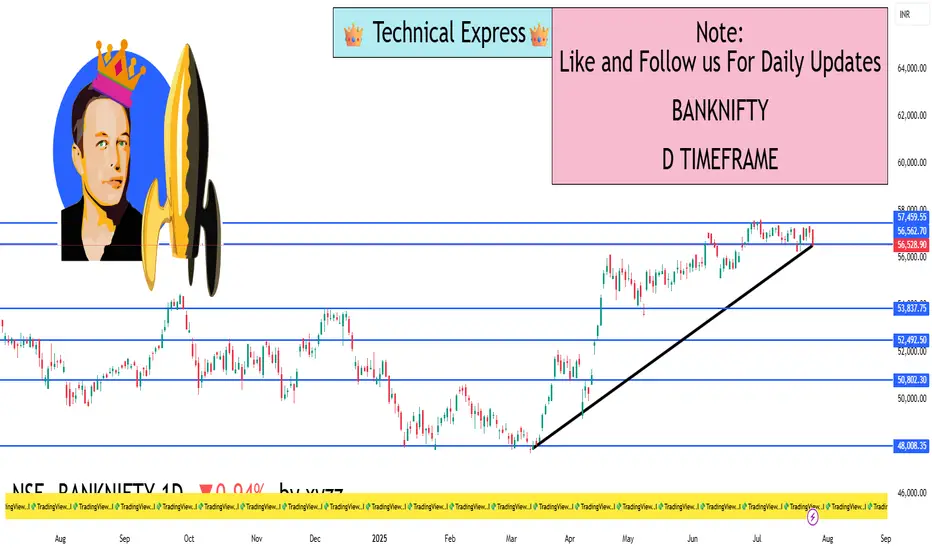
📉 Bank Nifty – Daily Overview (as of July 25, 2025)
Opening Price: Around 57,170
Day’s High: Around 57,170
Day’s Low: Around 56,439
Closing Price: Approximately 56,520
Net Change: Down by around 545 points (–0.95%)
🕯️ Candlestick Pattern (1D Chart)
The daily candle is bearish with a long upper wick and small lower wick.
This indicates strong selling pressure from the opening level.
The index failed to hold the highs and reversed sharply during the session.
🔍 Key Technical Zones
Level Price Range
Support 56,500 – 56,400
Next Support 56,150 – 56,000
Resistance 57,200 – 57,300
Major Resistance 57,500 – 57,650
If Bank Nifty breaks below 56,400, it may slide further toward 56,000 or even 55,800.
A move above 57,300 may invite bullish momentum.
📊 Trend & Technical Outlook
Short-Term Trend: Bearish
Medium-Term Trend: Neutral to mildly positive (if above 56,000)
Price Structure: Lower highs are forming; a descending pattern is developing.
Volume Analysis: Increasing volume on red candles suggests sellers are active.
Indicators (general behavior):
RSI may be near 50–55 range — neutral zone.
MACD likely showing bearish crossover.
Moving averages are flat to slightly negative.
✅ Strategy Suggestions
For Swing Traders:
Look for a bullish reversal pattern near 56,400–56,150 zone for possible long entries. Avoid long positions until price shows strength above 57,200.
For Breakdown Traders:
Wait for a solid close below 56,400 with high volume. Target levels can be 56,150 and 55,800.
For Intraday Traders:
Expect a volatile range between 56,400 and 57,200. Trade breakouts or reversals near these levels with confirmation.
📌 Summary
Bank Nifty is currently weak, with clear selling from resistance levels.
It is trading near key support (56,500–56,400). If this zone breaks, expect further downside.
Bulls need to reclaim 57,200+ for any reversal signals.
Trend remains bearish in short term, neutral in medium term.

Related publications
Disclaimer
The information and publications are not meant to be, and do not constitute, financial, investment, trading, or other types of advice or recommendations supplied or endorsed by TradingView. Read more in the Terms of Use.
Related publications
Disclaimer
The information and publications are not meant to be, and do not constitute, financial, investment, trading, or other types of advice or recommendations supplied or endorsed by TradingView. Read more in the Terms of Use.