
BHARAT ELECTRONICS LTD. (BEL) – TECHNICAL ANALYSIS
Chart Timeframe: Daily
CMP: ₹393.55
Setup: Descending Channel + Support Zone + Elliott Wave Structure
1. Key Technical Observation
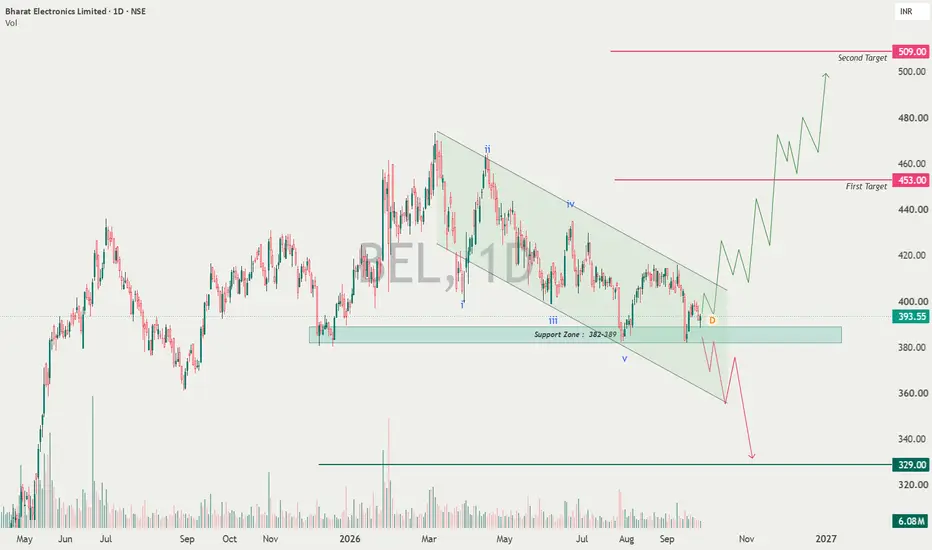
BEL has been trading inside a well-defined descending channel since the March 2026 high. Price has now reached an important support zone of ₹382–389, where previous price reactions are visible.
The stock is currently trading around ₹393.55, slightly above this support area. This makes ₹382–389 an important zone for the next directional move.
2. Bullish Scenario
A sustained hold above ₹382–389, followed by a breakout above the descending channel, could indicate that the corrective structure is completing.
Important upside levels:
• ₹420–425: Initial resistance / channel breakout area
• ₹440–453: Major resistance and First Target ₹453
• ₹480–490: Intermediate resistance
• ₹509: Second Target
The ₹453 and ₹509 targets shown on the chart are derived from the projected upside structure after a successful channel breakout and subsequent Fibonacci/Elliott-wave expansion.
3. Bearish Scenario
The bullish structure would weaken if the stock gives a decisive breakdown below ₹382.
Below the support zone, the next important downside areas visible on the chart are:
• ₹360: Channel breakdown / immediate downside zone
• ₹329: Major long-term support
A breakdown should ideally be confirmed by a strong daily closing below the support zone rather than by an intraday breach alone.
4. Important Levels
Resistance: ₹420 → ₹440 → ₹453 → ₹480 → ₹509
Support: ₹389 → ₹382 → ₹360 → ₹329
Key Decision Zone: ₹382–389
5. Trading View
As long as BEL sustains the ₹382–389 support zone, the chart structure remains constructive for a possible recovery toward ₹453 and potentially ₹509 after confirmation.
However, a decisive breakdown below ₹382 would invalidate the immediate bullish setup and could open the way toward ₹360 and ₹329.
Conclusion
BEL is currently at an important technical inflection point. The ₹382–389 support zone is the key level to watch, while a breakout from the descending channel can provide confirmation of a larger recovery structure.
Disclaimer: This analysis is for educational and informational purposes only. I am not a SEBI registered analyst. Please conduct your own research and use appropriate risk management before taking any trade or investment decision.

Disclaimer
The information and publications are not meant to be, and do not constitute, financial, investment, trading, or other types of advice or recommendations supplied or endorsed by TradingView. Read more in the Terms of Use.
Disclaimer
The information and publications are not meant to be, and do not constitute, financial, investment, trading, or other types of advice or recommendations supplied or endorsed by TradingView. Read more in the Terms of Use.