Biocon Limited is showing signs of a long-term bullish trend, supported by Elliott Wave theory and RSI strength above 50. Its current price action above key moving averages reinforces the momentum.
📈 Understanding Biocon’s Bullish Setup Through Elliott Wave and RSI
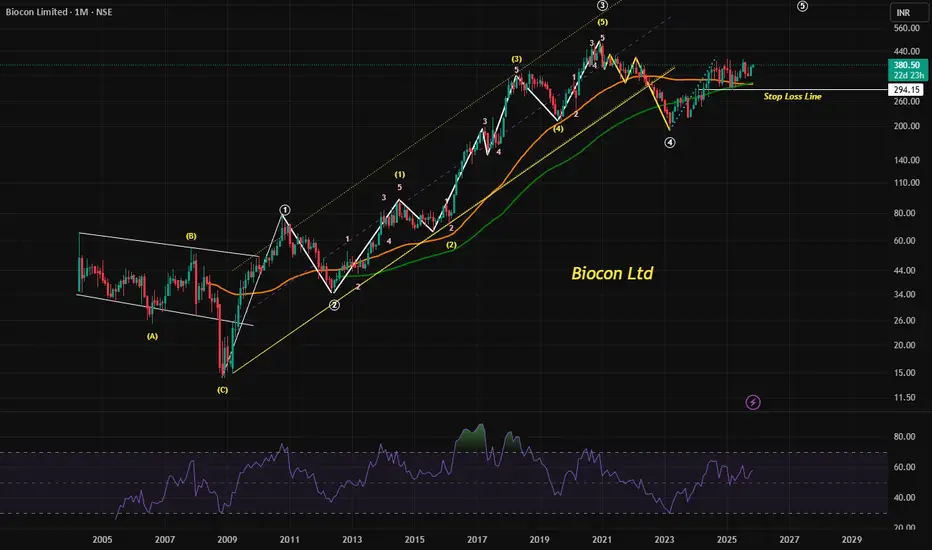
Biocon Limited, a prominent player in the biotechnology sector, is currently trading around ₹380.50. Technical analysis suggests that the stock is in the midst of a long-term bullish cycle, potentially targeting levels above ₹720. This projection is grounded in the principles of Elliott Wave Theory and supported by the Relative Strength Index (RSI) and moving average trends.
🔹 Elliott Wave Theory: Mapping Market Psychology
Elliott Wave Theory is a powerful tool used to analyze market cycles and investor psychology. It posits that prices move in repetitive wave patterns—five waves in the direction of the main trend followed by three corrective waves.
Wave 1 to 5: These represent the primary trend. In Biocon’s case, the current movement appears to be in the midst of this five-wave structure.
Wave 3 is typically the strongest and longest, often driven by fundamental catalysts and broad market participation.
Wave 5, which Biocon is believed to be entering or progressing through, often reflects the final push of bullish sentiment before a correction.
Given the current price and technical setup, the projection toward ₹720+ aligns with the completion of this five-wave pattern.
🔹 RSI: Momentum Confirmation
The Relative Strength Index (RSI) is a momentum oscillator that measures the speed and change of price movements. A reading above 50 typically indicates bullish momentum.
Since early 2024, Biocon’s RSI has consistently remained above the 50 mark, suggesting sustained buying interest and upward momentum.
This RSI behavior supports the Elliott Wave interpretation, reinforcing the idea that the stock is in a strong uptrend.
🔹 Moving Averages: Trend Validation
Moving averages help smooth out price data and confirm trends. Biocon’s price currently trades above both its:
50-day moving average (DMA): Indicates short- to mid-term bullishness.
100-day moving average (DMA): Suggests longer-term strength and investor confidence.
Trading above these key levels often acts as a support zone, reducing downside risk and attracting trend-following investors.
📊 Conclusion: A Technically Sound Rally
Biocon’s current technical landscape paints a compelling picture for long-term investors and swing traders:
The Elliott Wave structure suggests a continued rally toward ₹720+.
The RSI above 50 confirms bullish momentum.
Trading above 50 DMA and 100 DMA validates the trend.
While technical analysis offers valuable insights, investors should also consider fundamental developments and broader market conditions before making decisions.
📈 Understanding Biocon’s Bullish Setup Through Elliott Wave and RSI
Biocon Limited, a prominent player in the biotechnology sector, is currently trading around ₹380.50. Technical analysis suggests that the stock is in the midst of a long-term bullish cycle, potentially targeting levels above ₹720. This projection is grounded in the principles of Elliott Wave Theory and supported by the Relative Strength Index (RSI) and moving average trends.
🔹 Elliott Wave Theory: Mapping Market Psychology
Elliott Wave Theory is a powerful tool used to analyze market cycles and investor psychology. It posits that prices move in repetitive wave patterns—five waves in the direction of the main trend followed by three corrective waves.
Wave 1 to 5: These represent the primary trend. In Biocon’s case, the current movement appears to be in the midst of this five-wave structure.
Wave 3 is typically the strongest and longest, often driven by fundamental catalysts and broad market participation.
Wave 5, which Biocon is believed to be entering or progressing through, often reflects the final push of bullish sentiment before a correction.
Given the current price and technical setup, the projection toward ₹720+ aligns with the completion of this five-wave pattern.
🔹 RSI: Momentum Confirmation
The Relative Strength Index (RSI) is a momentum oscillator that measures the speed and change of price movements. A reading above 50 typically indicates bullish momentum.
Since early 2024, Biocon’s RSI has consistently remained above the 50 mark, suggesting sustained buying interest and upward momentum.
This RSI behavior supports the Elliott Wave interpretation, reinforcing the idea that the stock is in a strong uptrend.
🔹 Moving Averages: Trend Validation
Moving averages help smooth out price data and confirm trends. Biocon’s price currently trades above both its:
50-day moving average (DMA): Indicates short- to mid-term bullishness.
100-day moving average (DMA): Suggests longer-term strength and investor confidence.
Trading above these key levels often acts as a support zone, reducing downside risk and attracting trend-following investors.
📊 Conclusion: A Technically Sound Rally
Biocon’s current technical landscape paints a compelling picture for long-term investors and swing traders:
The Elliott Wave structure suggests a continued rally toward ₹720+.
The RSI above 50 confirms bullish momentum.
Trading above 50 DMA and 100 DMA validates the trend.
While technical analysis offers valuable insights, investors should also consider fundamental developments and broader market conditions before making decisions.
Disclaimer
The information and publications are not meant to be, and do not constitute, financial, investment, trading, or other types of advice or recommendations supplied or endorsed by TradingView. Read more in the Terms of Use.
Disclaimer
The information and publications are not meant to be, and do not constitute, financial, investment, trading, or other types of advice or recommendations supplied or endorsed by TradingView. Read more in the Terms of Use.