Birlasoft Ltd. is showing a bullish technical setup with a double bottom pattern and RSI positive divergence on the weekly chart, suggesting a potential trend reversal from recent lows.
Understanding the Setup: Double Bottom + RSI Divergence
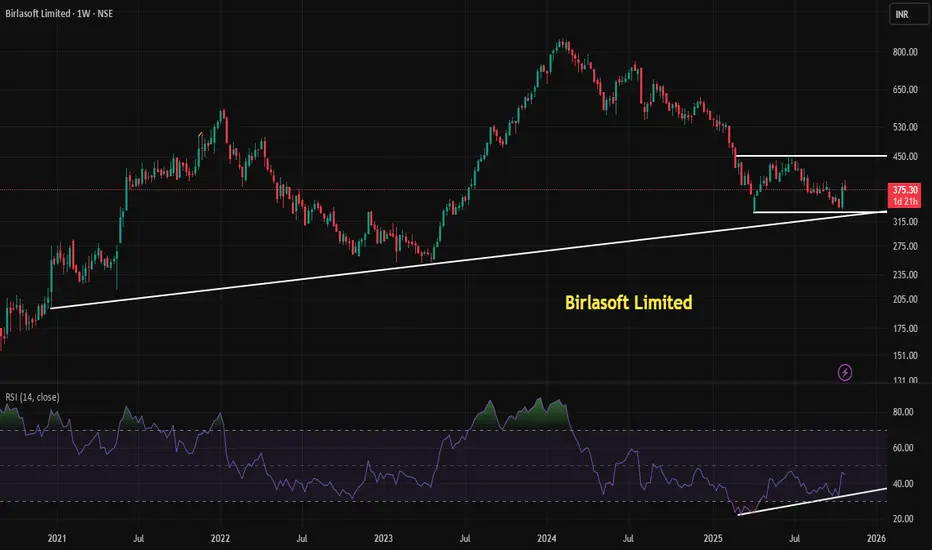
Birlasoft Ltd, currently trading around ₹376.60, has recently formed a double bottom pattern on its weekly chart—a classic bullish reversal signal. This pattern typically appears after a prolonged downtrend and consists of two distinct troughs at roughly the same price level, separated by a moderate peak. It reflects a shift in market sentiment from bearish to bullish.
In Birlasoft’s case, the two bottoms were formed near the ₹330 zone, indicating strong support. The neckline resistance lies around ₹450, and a breakout above this level could confirm the pattern and trigger further upside.
RSI Positive Divergence: Momentum Shift
Adding strength to this setup is the Relative Strength Index (RSI) positive divergence. While the stock price made a lower low/equal low during the second bottom, the RSI made a higher low—signaling that bearish momentum is weakening. This divergence often precedes a price reversal and suggests that buyers are gradually regaining control.
Educational Takeaway
This setup is a textbook example of how combining price action with momentum indicators can enhance technical analysis:
Double Bottom: Indicates potential reversal and strong support.
RSI Divergence: Confirms weakening bearish momentum.
Volume Confirmation: A breakout above ₹450 with rising volume would validate the pattern.
Traders often wait for a breakout above the neckline with strong volume before entering long positions. Stop-losses are typically placed just below the second bottom to manage risk.
Final Thoughts
While the technicals suggest a bullish bias, it's crucial to monitor broader market conditions and company fundamentals. Birlasoft operates in the IT services sector, which is sensitive to global tech trends and client spending cycles.
This live chart analysis offers a compelling case for a potential trend reversal, but disciplined execution and risk management remain key.
Understanding the Setup: Double Bottom + RSI Divergence
Birlasoft Ltd, currently trading around ₹376.60, has recently formed a double bottom pattern on its weekly chart—a classic bullish reversal signal. This pattern typically appears after a prolonged downtrend and consists of two distinct troughs at roughly the same price level, separated by a moderate peak. It reflects a shift in market sentiment from bearish to bullish.
In Birlasoft’s case, the two bottoms were formed near the ₹330 zone, indicating strong support. The neckline resistance lies around ₹450, and a breakout above this level could confirm the pattern and trigger further upside.
RSI Positive Divergence: Momentum Shift
Adding strength to this setup is the Relative Strength Index (RSI) positive divergence. While the stock price made a lower low/equal low during the second bottom, the RSI made a higher low—signaling that bearish momentum is weakening. This divergence often precedes a price reversal and suggests that buyers are gradually regaining control.
Educational Takeaway
This setup is a textbook example of how combining price action with momentum indicators can enhance technical analysis:
Double Bottom: Indicates potential reversal and strong support.
RSI Divergence: Confirms weakening bearish momentum.
Volume Confirmation: A breakout above ₹450 with rising volume would validate the pattern.
Traders often wait for a breakout above the neckline with strong volume before entering long positions. Stop-losses are typically placed just below the second bottom to manage risk.
Final Thoughts
While the technicals suggest a bullish bias, it's crucial to monitor broader market conditions and company fundamentals. Birlasoft operates in the IT services sector, which is sensitive to global tech trends and client spending cycles.
This live chart analysis offers a compelling case for a potential trend reversal, but disciplined execution and risk management remain key.
Disclaimer
The information and publications are not meant to be, and do not constitute, financial, investment, trading, or other types of advice or recommendations supplied or endorsed by TradingView. Read more in the Terms of Use.
Disclaimer
The information and publications are not meant to be, and do not constitute, financial, investment, trading, or other types of advice or recommendations supplied or endorsed by TradingView. Read more in the Terms of Use.