CANDLE MASTER Update!
Bitcoin (BTC/USD) showing a bullish market structure with a clear ascending channel and breakout pattern. Here's a detailed analysis:
Key Observations:
1. Ascending Channel:
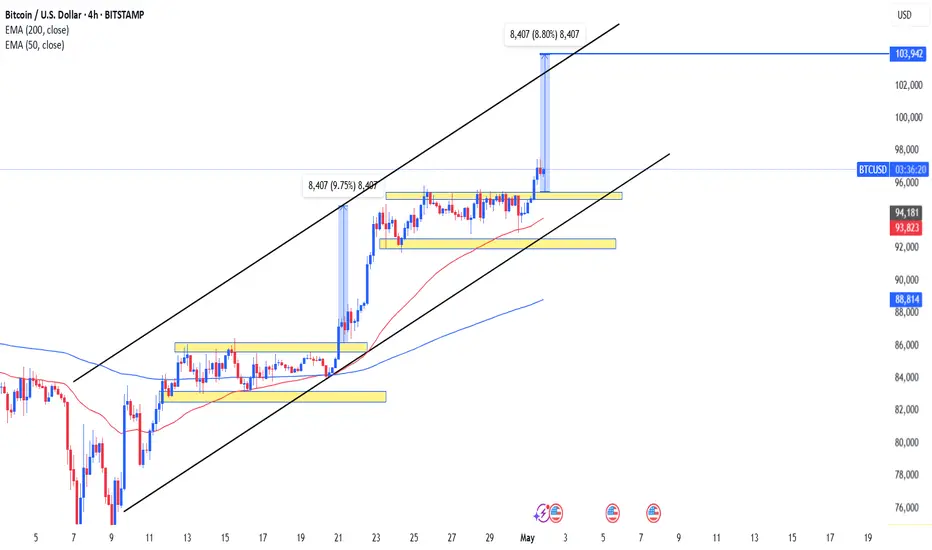
The price is moving within an ascending channel (black lines), showing a bullish trend.
Bitcoin has recently broken out above a consolidation range, continuing the bullish momentum.
2. Support Zones (Yellow Boxes):
Multiple horizontal support zones have been marked where price previously consolidated before breaking out.
These zones could act as support if there's a retracement.
3. Breakout Projection:
The breakout move is highlighted with a vertical measurement of 8,407 points, or approximately 8.80%.
This same measurement has been projected upward from the recent breakout, targeting around $103,942, which is the next price objective.
4. Moving Averages:
50 EMA (red) and 200 EMA (blue) are both trending upwards, which supports the bullish trend.
Price is trading well above both EMAs, indicating strong bullish momentum.
5. Volume/Timing:
No volume is shown, but the structure suggests accumulation phases followed by sharp upward moves — classic signs of breakout trading behavior.
Conclusion:
Bitcoin appears to be in a strong bullish trend with momentum likely continuing toward the $103,942 level as per the breakout projection. Support is well defined below, and unless price breaks below the lower trendline or major EMAs, the bullish outlook remains intact.
Bitcoin (BTC/USD) showing a bullish market structure with a clear ascending channel and breakout pattern. Here's a detailed analysis:
Key Observations:
1. Ascending Channel:
The price is moving within an ascending channel (black lines), showing a bullish trend.
Bitcoin has recently broken out above a consolidation range, continuing the bullish momentum.
2. Support Zones (Yellow Boxes):
Multiple horizontal support zones have been marked where price previously consolidated before breaking out.
These zones could act as support if there's a retracement.
3. Breakout Projection:
The breakout move is highlighted with a vertical measurement of 8,407 points, or approximately 8.80%.
This same measurement has been projected upward from the recent breakout, targeting around $103,942, which is the next price objective.
4. Moving Averages:
50 EMA (red) and 200 EMA (blue) are both trending upwards, which supports the bullish trend.
Price is trading well above both EMAs, indicating strong bullish momentum.
5. Volume/Timing:
No volume is shown, but the structure suggests accumulation phases followed by sharp upward moves — classic signs of breakout trading behavior.
Conclusion:
Bitcoin appears to be in a strong bullish trend with momentum likely continuing toward the $103,942 level as per the breakout projection. Support is well defined below, and unless price breaks below the lower trendline or major EMAs, the bullish outlook remains intact.
Trade active
TRADE ACTIVE NOW Trade closed: target reached
As I analysed the chart now market touched the resistance point and working well hope you taked profits and benefits from my analysis stay in touched for more good setups very soon I will share another analyseRelated publications
Disclaimer
The information and publications are not meant to be, and do not constitute, financial, investment, trading, or other types of advice or recommendations supplied or endorsed by TradingView. Read more in the Terms of Use.
Related publications
Disclaimer
The information and publications are not meant to be, and do not constitute, financial, investment, trading, or other types of advice or recommendations supplied or endorsed by TradingView. Read more in the Terms of Use.