Castrol India is showing an interesting setup both fundamentally and technically ahead of its upcoming quarterly results on 4th November 2025.
🔹 Fundamental View:
The company has maintained strong performance over recent quarters —
Net Sales steadily growing from ₹1,293 Cr (Mar 2023) to ₹1,496 Cr (Jun 2025).
EBITDA and PAT margins holding firm around 22–23% and 16%, respectively.
Very low debt levels with negligible interest costs.
Overall, Castrol continues to deliver stable profitability and cash flows, a positive sign for long-term investors.
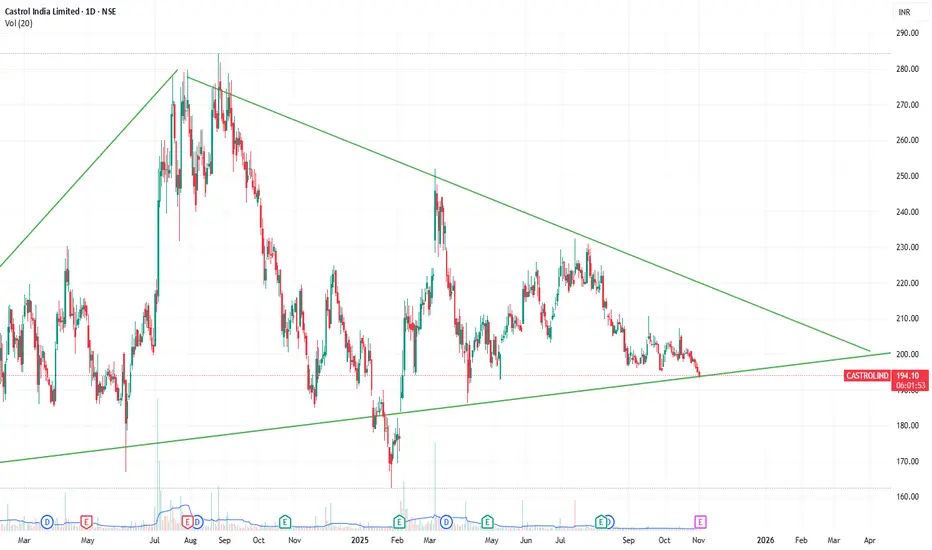
🔹 Technical View:
The stock is currently trading near a strong trendline support zone around ₹190–195, forming a large symmetrical triangle since early 2024.
Support: ₹190
Resistance: ₹210–225
Pattern: Symmetrical triangle tightening towards breakout zone
RSI near neutral–oversold zone (suggesting possible reversal)
🔹 My View:
The setup looks attractive for a potential bounce or breakout if the results come strong.
If ₹190 holds, we can expect a short-term move towards ₹210–₹230, and possibly ₹250+ on breakout confirmation.
Stop loss: ₹185
Conclusion:
Studying this setup closely — both fundamentals and technicals indicate strength.
I’m bullish on Castrol India for a result-based momentum move.
Let’s watch how the stock reacts post-results.
📝 Note:
This analysis is shared purely for educational and study purposes, not as financial advice.
Always do your own research or consult a qualified advisor before making any investment decisions.
🔹 Fundamental View:
The company has maintained strong performance over recent quarters —
Net Sales steadily growing from ₹1,293 Cr (Mar 2023) to ₹1,496 Cr (Jun 2025).
EBITDA and PAT margins holding firm around 22–23% and 16%, respectively.
Very low debt levels with negligible interest costs.
Overall, Castrol continues to deliver stable profitability and cash flows, a positive sign for long-term investors.
🔹 Technical View:
The stock is currently trading near a strong trendline support zone around ₹190–195, forming a large symmetrical triangle since early 2024.
Support: ₹190
Resistance: ₹210–225
Pattern: Symmetrical triangle tightening towards breakout zone
RSI near neutral–oversold zone (suggesting possible reversal)
🔹 My View:
The setup looks attractive for a potential bounce or breakout if the results come strong.
If ₹190 holds, we can expect a short-term move towards ₹210–₹230, and possibly ₹250+ on breakout confirmation.
Stop loss: ₹185
Conclusion:
Studying this setup closely — both fundamentals and technicals indicate strength.
I’m bullish on Castrol India for a result-based momentum move.
Let’s watch how the stock reacts post-results.
📝 Note:
This analysis is shared purely for educational and study purposes, not as financial advice.
Always do your own research or consult a qualified advisor before making any investment decisions.
Related publications
Disclaimer
The information and publications are not meant to be, and do not constitute, financial, investment, trading, or other types of advice or recommendations supplied or endorsed by TradingView. Read more in the Terms of Use.
Related publications
Disclaimer
The information and publications are not meant to be, and do not constitute, financial, investment, trading, or other types of advice or recommendations supplied or endorsed by TradingView. Read more in the Terms of Use.