
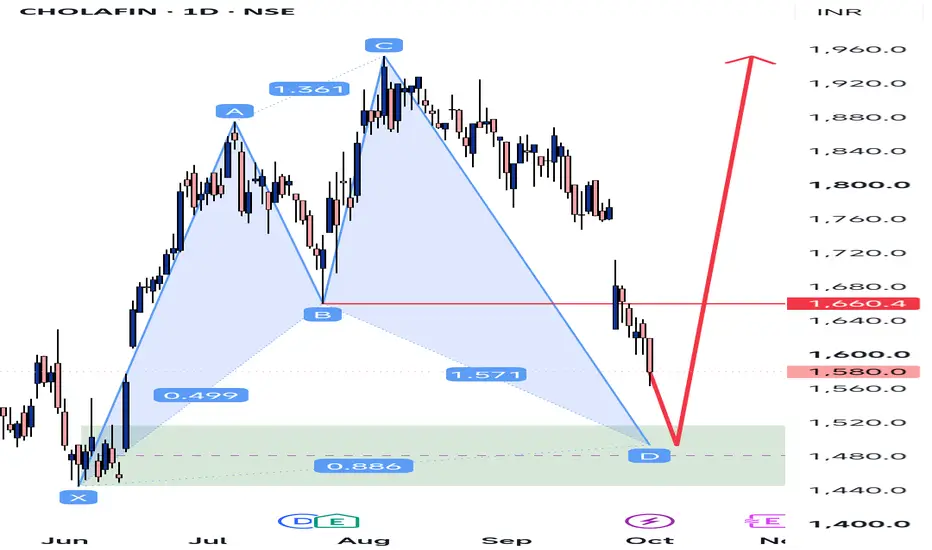
The chart shows a potential XABCD harmonic reversal structure developing on the daily timeframe, with D forming inside a major demand/PRZ zone around ₹1,480–₹1,520.
🔹 Harmonic structure
X: ~₹1,445 — major swing low
A: ~₹1,875 — first major impulsive high
B: ~₹1,650 — retracement
C: ~₹1,955 — higher swing high
D: ~₹1,480 — projected reversal area
The displayed Fibonacci relationships are approximately:
AB/XA = 0.499
BC/AB = 1.361
CD/BC = 1.571
AD/XA = 0.886
The 0.886 XA retracement at D is particularly important because it places the potential reversal close to the original X swing-low region.
🔹 PRZ / Demand Zone
The green zone around ₹1,440–₹1,520 is the key Potential Reversal Zone (PRZ).
This area has several confluences:
1. 0.886 retracement of XA
2. Previous swing-low area around X
3. Historical demand/support
4. Completion of the XABCD structure
5. Strong reaction potential after the recent decline
Therefore, ₹1,480–₹1,520 should be treated as a decision zone, rather than assuming an immediate reversal.
🔹 Important confirmation level – ₹1,660
The horizontal level at approximately ₹1,660.40 is the first major confirmation/resistance level.
A bullish scenario becomes technically stronger if price:
Holds the PRZ → forms a bullish reversal → breaks ₹1,660 → sustains above ₹1,660.
A daily close above ₹1,660 could indicate that buyers are beginning to regain control.
🔹 Potential upside levels
If the PRZ holds and ₹1,660 is reclaimed, the chart structure gives several potential resistance/target zones:
T1: ₹1,660–₹1,680
Initial breakout/confirmation zone.
T2: ₹1,760–₹1,800
Previous price congestion and supply area.
T3: ₹1,840–₹1,880
Major previous swing/resistance region.
T4: ₹1,920–₹1,960
Near the previous C high and the projected upside shown on the chart.
The ₹1,960 area is particularly important because it corresponds approximately to the previous major swing high.
🔻 Invalidation
The bullish harmonic thesis becomes weaker if price decisively loses the PRZ.
A daily close below ₹1,440 would substantially damage the current bullish structure because it would break below the X swing-low/support region.
So the structure can be viewed as:
₹1,440–₹1,520 → PRZ / demand
⬆️
₹1,660 → confirmation
⬆️
₹1,760–₹1,800 → resistance
⬆️
₹1,840–₹1,880 → major resistance
⬆️
₹1,920–₹1,960 → previous swing-high zone
📌 TradingView-ready post
CHOLAFIN | Daily | Potential Bullish Harmonic Reversal
CHOLAFIN is approaching a critical Potential Reversal Zone (PRZ) around ₹1,480–₹1,520, where the XABCD structure completes near the 0.886 XA retracement.
The stock has experienced a significant decline from the ₹1,950–₹1,960 region and is now approaching the previous swing-low/demand area.
The key level to watch is ₹1,660.40.
A potential bullish sequence would be:
PRZ hold → bullish reversal → ₹1,660 breakout → ₹1,760 → ₹1,840–₹1,880 → ₹1,920–₹1,960
However, this is a conditional setup, not a prediction. Price acceptance above ₹1,660 would provide stronger confirmation, while a decisive breakdown below ₹1,440 would invalidate the current bullish structure.
Key levels:
🟢 PRZ: ₹1,480–₹1,520
🔵 Confirmation: ₹1,660
🎯 Resistance: ₹1,760 / ₹1,840–₹1,880 / ₹1,920–₹1,960
🔴 Structure invalidation: Below ₹1,440
Watch the reaction at D rather than anticipating the reversal.
#CHOLAFIN #CholamandalamFinance #HarmonicPattern #XABCD #PriceAction #TechnicalAnalysis #Fibonacci #PRZ #DemandZone #TradingView #SwingTrading #NSE
Technical note: I would describe this as a potential/custom XABCD harmonic structure rather than labeling it definitively as a standard Gartley/Bat/Butterfly, because the displayed Fibonacci ratios do not cleanly satisfy the conventional ratio rules of those named patterns.

Disclaimer
The information and publications are not meant to be, and do not constitute, financial, investment, trading, or other types of advice or recommendations supplied or endorsed by TradingView. Read more in the Terms of Use.
Disclaimer
The information and publications are not meant to be, and do not constitute, financial, investment, trading, or other types of advice or recommendations supplied or endorsed by TradingView. Read more in the Terms of Use.