Hello Friends,
Welcome to RK_Chaarts.
Today, we have brought this post to illustrate how we apply Elliott Wave Theory using the FMCG sector chart as an example for educational purposes.
In this post, we will analyze the Nifty FMCG Sector Index chart and see how Elliott Wave Theory can help us anticipate the potential direction of the market. We have previously discussed Elliott Wave Theory several times, and today we will apply it to the FMCG sector.
During this analysis, we will observe how the FMCG sector chart can be divided into various waves according to Elliott Wave Theory & its Principles, and how we can use these waves to forecast the future market direction. This post is purely for educational purposes and is not intended to provide any investment recommendations.
Elliott Wave Theory Principles
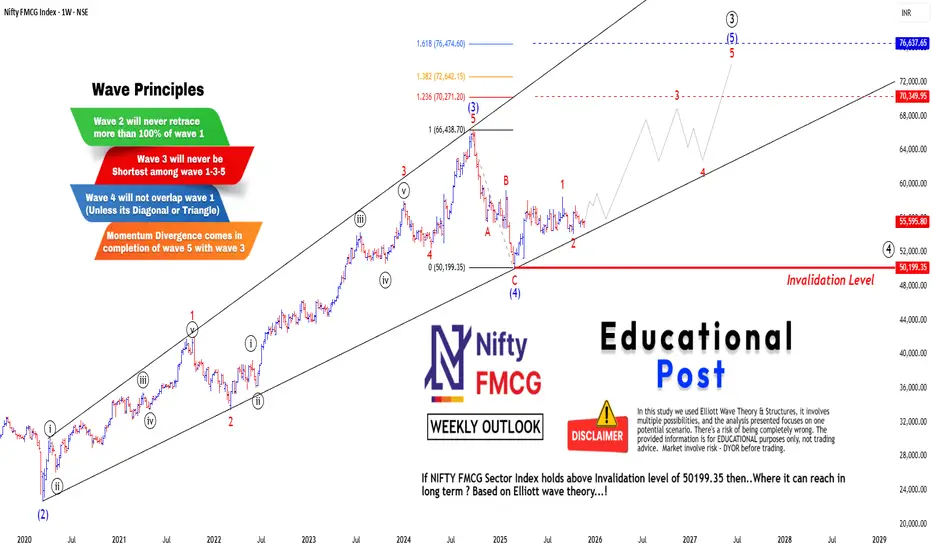
1) Wave 2 will never retrace more than 100% of wave 1.
2) Wave 3 will Never be shortest among all three Impulses (1-3-5)
3) Wave 4 will Never enter into the Territory of wave 1.
(Except Diagonals and Triangles)
4) Momentum RSI Divergence in Wave 3 & Wave 5.
Let's start,
We can clearly see that the sector index chart completed Wave (2) of intermediate degree (Blue) during the March 2020 fall (COVID period). After that, it moved continuously bullish and completed Wave (3) of intermediate degree (Blue) at the top of September 2024. From there, it continuously showed a fall downwards, completing Wave (4) of intermediate degree (Blue) at 50199.35 which is bottom in March 2025.
After that, the index has been moving slightly sideways to bullish, but there is still no strength or momentum visible in it. So, friends, if we assume the projection where Wave (5) can reach using Fibonacci trend-based Fib extension based on Elliott Wave Theory, Considering move in Waves (3) to (4), it can potentially reach around somewhere between fib level 1.236 to 1.618 levels in the long term in the future because this is a weekly time frame chart.
It has an invalidation level which is the low of Wave (4) pegged at 50199.35 on the chart. If the price falls even one point below this level, we will definitely have to reanalyze our wave counts and all these assumptions will get invalidated. Then we have assume that Wave (4) is still ongoing or something else is possible. So currently, assuming Wave (4) is finished, we have started the journey of Wave (5). These are assumptions as long as the price stays above the invalidation level; we can assume it will reach somewhere between fib level 1.236 to 1.618 levels in the next 1.5 to 2 years.
This analysis is based on Elliott Wave Theory and is shared purely for educational purposes to show how Elliott Wave Theory can be used to forecast a market roadmap.
I am not Sebi registered analyst.
My studies are for educational purpose only.
Please Consult your financial advisor before trading or investing.
I am not responsible for any kinds of your profits and your losses.
Most investors treat trading as a hobby because they have a full-time job doing something else.
However, If you treat trading like a business, it will pay you like a business.
If you treat like a hobby, hobbies don't pay, they cost you...!
Hope this post is helpful to community
Thanks
RK💕
Disclaimer and Risk Warning.
The analysis and discussion provided on in.tradingview.com/u/RK_Charts/ is intended for educational purposes only and should not be relied upon for trading decisions. RK_Chaarts is not an investment adviser and the information provided here should not be taken as professional investment advice. Before buying or selling any investments, securities, or precious metals, it is recommended that you conduct your own due diligence. RK_Chaarts does not share in your profits and will not take responsibility for any losses you may incur. So Please Consult your financial advisor before trading or investing.
Welcome to RK_Chaarts.
Today, we have brought this post to illustrate how we apply Elliott Wave Theory using the FMCG sector chart as an example for educational purposes.
In this post, we will analyze the Nifty FMCG Sector Index chart and see how Elliott Wave Theory can help us anticipate the potential direction of the market. We have previously discussed Elliott Wave Theory several times, and today we will apply it to the FMCG sector.
During this analysis, we will observe how the FMCG sector chart can be divided into various waves according to Elliott Wave Theory & its Principles, and how we can use these waves to forecast the future market direction. This post is purely for educational purposes and is not intended to provide any investment recommendations.
Elliott Wave Theory Principles
1) Wave 2 will never retrace more than 100% of wave 1.
2) Wave 3 will Never be shortest among all three Impulses (1-3-5)
3) Wave 4 will Never enter into the Territory of wave 1.
(Except Diagonals and Triangles)
4) Momentum RSI Divergence in Wave 3 & Wave 5.
Let's start,
We can clearly see that the sector index chart completed Wave (2) of intermediate degree (Blue) during the March 2020 fall (COVID period). After that, it moved continuously bullish and completed Wave (3) of intermediate degree (Blue) at the top of September 2024. From there, it continuously showed a fall downwards, completing Wave (4) of intermediate degree (Blue) at 50199.35 which is bottom in March 2025.
After that, the index has been moving slightly sideways to bullish, but there is still no strength or momentum visible in it. So, friends, if we assume the projection where Wave (5) can reach using Fibonacci trend-based Fib extension based on Elliott Wave Theory, Considering move in Waves (3) to (4), it can potentially reach around somewhere between fib level 1.236 to 1.618 levels in the long term in the future because this is a weekly time frame chart.
It has an invalidation level which is the low of Wave (4) pegged at 50199.35 on the chart. If the price falls even one point below this level, we will definitely have to reanalyze our wave counts and all these assumptions will get invalidated. Then we have assume that Wave (4) is still ongoing or something else is possible. So currently, assuming Wave (4) is finished, we have started the journey of Wave (5). These are assumptions as long as the price stays above the invalidation level; we can assume it will reach somewhere between fib level 1.236 to 1.618 levels in the next 1.5 to 2 years.
This analysis is based on Elliott Wave Theory and is shared purely for educational purposes to show how Elliott Wave Theory can be used to forecast a market roadmap.
I am not Sebi registered analyst.
My studies are for educational purpose only.
Please Consult your financial advisor before trading or investing.
I am not responsible for any kinds of your profits and your losses.
Most investors treat trading as a hobby because they have a full-time job doing something else.
However, If you treat trading like a business, it will pay you like a business.
If you treat like a hobby, hobbies don't pay, they cost you...!
Hope this post is helpful to community
Thanks
RK💕
Disclaimer and Risk Warning.
The analysis and discussion provided on in.tradingview.com/u/RK_Charts/ is intended for educational purposes only and should not be relied upon for trading decisions. RK_Chaarts is not an investment adviser and the information provided here should not be taken as professional investment advice. Before buying or selling any investments, securities, or precious metals, it is recommended that you conduct your own due diligence. RK_Chaarts does not share in your profits and will not take responsibility for any losses you may incur. So Please Consult your financial advisor before trading or investing.
YouTube: youtube.com/@rk_charts
Telegram : t.me/RK_Charts
Twitter : @charts_rk
Email : rkcharts@gmail. com
Disclaimer.
I am not sebi registered analyst.
My studies are for educational purpose only.
Telegram : t.me/RK_Charts
Twitter : @charts_rk
Email : rkcharts@gmail. com
Disclaimer.
I am not sebi registered analyst.
My studies are for educational purpose only.
Related publications
Disclaimer
The information and publications are not meant to be, and do not constitute, financial, investment, trading, or other types of advice or recommendations supplied or endorsed by TradingView. Read more in the Terms of Use.