
Overview
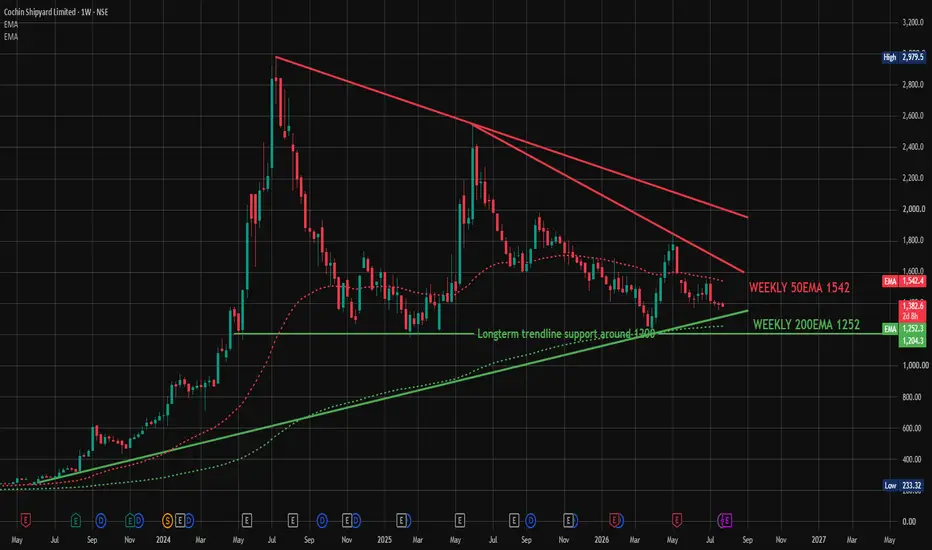
Cochin Shipyard is currently testing a long-term trendline support around 1,200–1,250, with the weekly 200 EMA sitting right in this zone too. Before treating this as a simple "buy the dip" opportunity, it's worth digging into the fundamentals — and the picture here is more cautious than it first appears.
What's Happening on the Chart
Price has pulled back sharply from its highs and is now testing a long-term rising trendline that's held since the stock's early years. The weekly 200 EMA (around 1,252) is right at this same zone, adding some technical weight to the level. That's the good part of the story.
What the Fundamentals Actually Show
This is where things get more nuanced. Looking at the last few years:
Revenue has kept growing — from ₹3,830 Cr (FY24) to ₹4,820 Cr (FY25) to ₹5,022 Cr (FY26) — but growth has slowed sharply, from +24% to just +4%
Net profit actually fell in FY26 — down to ₹717 Cr from ₹827 Cr the year before, even though revenue was still growing. That's a warning sign worth taking seriously
Operating margins have compressed — from 23% (FY24) down to 16% (FY26), continuing a multi-year decline rather than a one-off dip
ROCE has weakened — from 21% to 16% over the past two years, meaning the business is generating less return on the capital it uses
Working capital cycle has stretched dramatically — the cash conversion cycle has gone from 54 days (FY21) to 250 days now, driven mainly by inventory sitting on the books far longer (379 days, up from 139 days). This usually points to slower project execution or delivery delays
Debt jumped sharply — borrowings rose from ₹560 Cr to ₹1,672 Cr in just one year, roughly 3x. That's a real shift in the balance sheet that wasn't there before
One Encouraging Sign
Looking quarter by quarter within FY26, there's been a recovering trend — sales have grown steadily each quarter (1,069 → 1,119 → 1,350 → 1,484 Cr), and operating margins improved too (7% → 14% → 21%). So while the full-year picture looks weaker than FY25, the most recent quarters suggest things may be stabilizing.
Key Levels to Watch
Trendline + 200 EMA Support: ~1,200–1,252
Weekly 50 EMA (Resistance): ~1,542
What This Means
If the support holds technically: That's worth noting, but given the fundamental picture, it shouldn't be treated as an automatic buy signal on its own.
If the recent quarterly recovery continues for another cycle or two — meaning sales and margins keep improving like they did through FY26 — that would be a meaningful sign the business is turning a corner. A sustained trend like that, over one or two more quarters, could be enough to bring long-term investors back with more confidence, since it would show the recent weakness was temporary rather than a structural problem.
If the fundamentals stay weak or get worse — continued margin pressure, rising debt, stretched working capital — then this support test becomes a much less attractive opportunity, regardless of what the chart shows.
Beginner's Lesson
A stock sitting at a well-known support level can look tempting, but the chart alone never tells the whole story. Here, the technical setup looks fine, but the business has shown real signs of strain over the past year — declining profit, falling capital efficiency, and rising debt. The smart approach isn't to ignore the support test, but to wait and see whether the recent quarterly recovery holds up over the next cycle or two before treating this as a genuine opportunity rather than a falling knife.
Conclusion
Cochin Shipyard is testing an important technical level, but the fundamentals call for patience rather than urgency. If the recent quarterly improvement continues for another cycle or two, this could become a much more attractive long-term case. Until then, this is one to watch closely rather than jump into.
Chart and financial data shown are for illustration and educational purposes only. Not investment advice. Please do your own research or consult a financial advisor before making any investment decisions. Fundamental data sourced from Screener.in

📈 HK Trading Community | Market Structure & Indicator Updates
Telegram: t.me/trendstrike1000
Website: quantumedgepro.netlify.app/
Real traders are built through learning,not tip hunting.So Start Learning How the Market Really Works
Telegram: t.me/trendstrike1000
Website: quantumedgepro.netlify.app/
Real traders are built through learning,not tip hunting.So Start Learning How the Market Really Works
Related publications
Disclaimer
The information and publications are not meant to be, and do not constitute, financial, investment, trading, or other types of advice or recommendations supplied or endorsed by TradingView. Read more in the Terms of Use.