
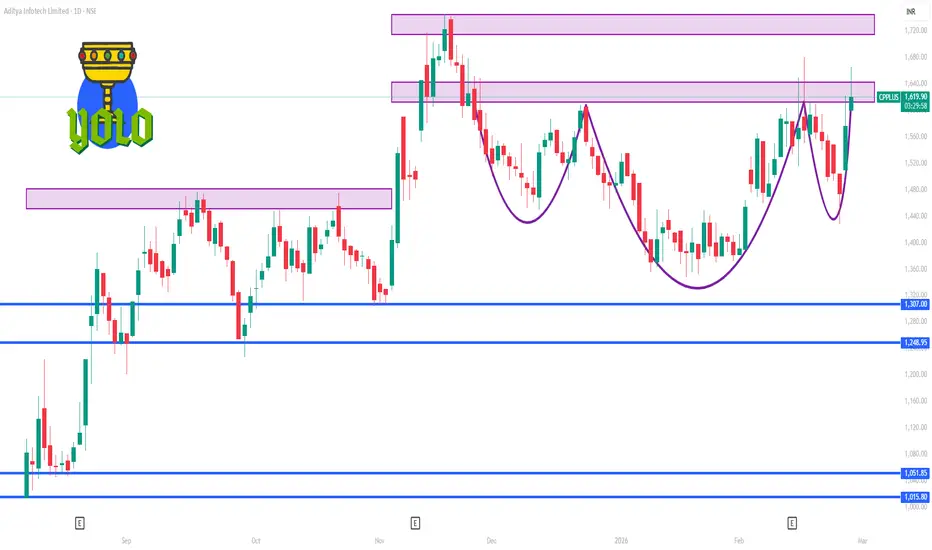
📊 DAILY TECHNICAL LEVELS (1-Day Pivot Points)
(These are standard pivot point levels calculated from the previous day’s price range — used by traders for intraday/daily bias)
Pivot Point (P)
➡️ **~₹1,570 ** – main daily reference point (trend bias)
Resistance Levels (Upside targets)
R1: ~₹1,610 – ₹1,650
R2: ~₹1,635 – ₹1,713
R3: ~₹1,675 – ₹1,777
Support Levels (Downside guards)
S1: ~₹1,505 – ₹1,520
S2: ~₹1,445 – ₹1,471
S3: ~₹1,375 – ₹1,391
📌 HOW TO USE THESE LEVELS (DAILY VIEW)
🔹 Bullish bias: Price trading above pivot (~₹1,570) → look for upside moves toward R1 and R2.
🔹 Bearish bias: Price trading below pivot → down moves toward S1 / S2 become more likely.
🔹 Key intraday flip zone: Pivot ➝ R1 area (~₹1,570–₹1,650). Holding above this shows buyer strength.
🔹 Breakdown alert: Closing below S1 (~₹1,505–₹1,520) could speed up weakness.
📉 ADDITIONAL TECH INDICATORS (for context)
20–50–100 day averages are near current price range — suggesting a neutral to moderately bullish trend on daily charts.
RSI around ~60+ — indicates bullish bias but not overbought extreme yet.
📌 SUMMARY (DAILY / 1-DAY FRAME)
Level Price
Pivot (neutral/direction trigger) ~₹1,570
Bullish target zone ₹1,610 → ₹1,650+
Strong resistance ₹1,713 → ₹1,777
Immediate support ₹1,505 → ₹1,520
Deeper support ₹1,445 → ₹1,391

Contact Knowledgehub for a detailed consultation: Dm on WhatsApp: [wa.link/a2o0kz]-
Phone No: [+91 93102 26243]-
Email: [tradingviewknowledgehub@gmail.com]---
-- Let’s achieve success together!
Phone No: [+91 93102 26243]-
Email: [tradingviewknowledgehub@gmail.com]---
-- Let’s achieve success together!
Related publications
Disclaimer
The information and publications are not meant to be, and do not constitute, financial, investment, trading, or other types of advice or recommendations supplied or endorsed by TradingView. Read more in the Terms of Use.