Long
DIA Long Setup
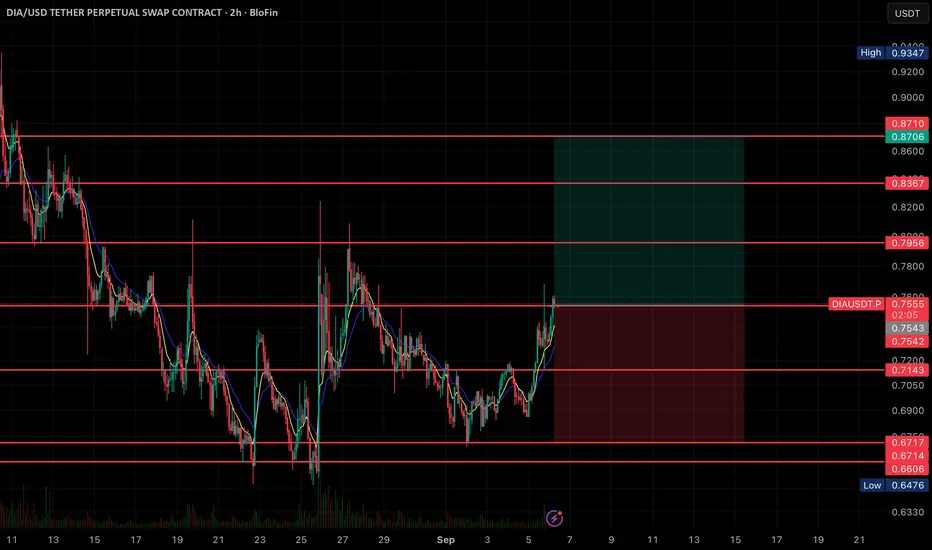
Setup Overview
• Pair: DIA/USDT Perpetual Swap
• Timeframe: 2H
• Current Price: ~0.754
• Chart Type: Candlestick with moving averages
Key Observations
1. Support Levels
• 0.714 → Strong support zone (recent bounce point).
• 0.671 – 0.660 → Major support cluster.
• 0.647 → Recent swing low (strong bottom support).
2. Resistance Levels
• 0.795 → First resistance.
• 0.837 → Next resistance above.
• 0.870 – 0.871 → Target resistance zone (aligned with green TP zone).
3. Current Price Action
• Price has bounced from the 0.714 support and is trading above EMAs, showing short-term bullish momentum.
• The move suggests a potential push toward higher resistances if momentum continues.
4. Trade Setup
• Entry: Around 0.754 (current price).
• Stop-Loss (SL): Below 0.714 support (around 0.71).
• Take-Profit (TP): 0.795 → 0.837 → 0.870.
5. Risk–Reward
• The risk is defined below 0.714, while the upside potential stretches toward 0.87.
• This gives a favorable risk-to-reward setup if bullish continuation holds.
✅ Bias: Short-term bullish as long as price stays above 0.714.

Disclaimer
The information and publications are not meant to be, and do not constitute, financial, investment, trading, or other types of advice or recommendations supplied or endorsed by TradingView. Read more in the Terms of Use.
Disclaimer
The information and publications are not meant to be, and do not constitute, financial, investment, trading, or other types of advice or recommendations supplied or endorsed by TradingView. Read more in the Terms of Use.