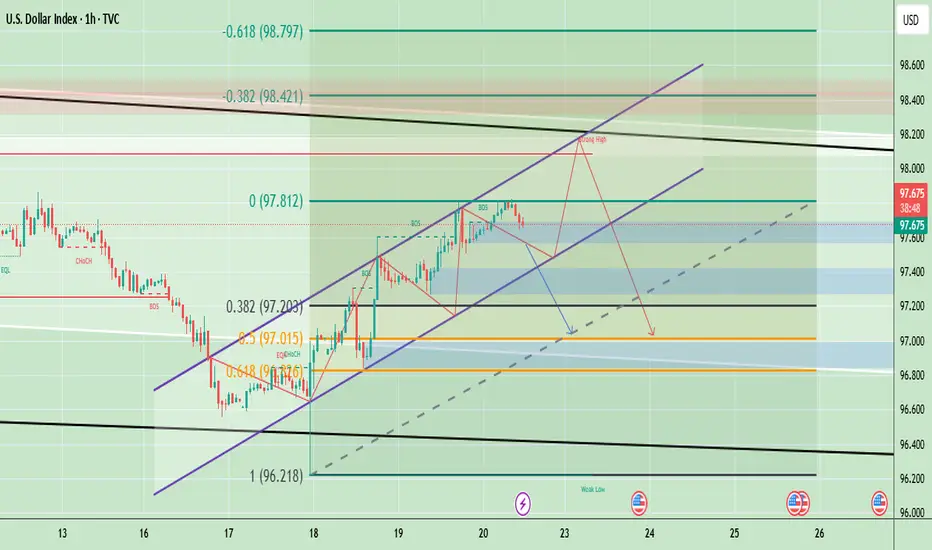
DXY (U.S. Dollar Index) is trading around 97.71, holding within an upward channel after bouncing from the 97.00–97.10 support zone. The structure shows a series of higher highs and higher lows, indicating short-term bullish momentum. However, the chart also highlights a potential “strong high” area near 98.20–98.40, where resistance from both Fibonacci retracement levels and channel tops converge. If DXY fails to break above this resistance, a retracement toward 97.20–97.00 is likely, with further downside risk toward 96.80 if that support breaks.
Based on the current setup, short-term upside toward 98.20–98.40 is possible, but overall bias suggests a likely pullback (downside) after testing resistance, especially if momentum weakens near the channel top.
🔴 Sell Zone (Short Setup)
- Sell Zone (Resistance area): 98.20 – 98.40
- Sell Trigger: If price tests and rejects this zone with bearish candles (reversal signals).
🟢 Buy Zone (Long Setup)
- Buy Zone (Support area): 97.20 – 97.30
- Buy Trigger: If price holds above this zone and shows bullish reversal candles (hammer, engulfing, etc.).
Note
Please risk management in trading is a Key so use your money accordingly. If you like the idea then please like and boost. Thank you and Good Luck!
Trade active
U.S. Dollar Index (DXY) is trading near 97.30, just below the key resistance at 97.40. The chart indicates bearish pressure, with potential downside targets toward the 97.00–96.80 demand zone if resistance holds. A sustained move above 97.40 could shift momentum back toward 97.80, but overall outlook currently favors a bearish continuation.
Note
A break of this bear flag would likely target 97, with 96.80 as an extended target.
Disclaimer
The information and publications are not meant to be, and do not constitute, financial, investment, trading, or other types of advice or recommendations supplied or endorsed by TradingView. Read more in the Terms of Use.
Disclaimer
The information and publications are not meant to be, and do not constitute, financial, investment, trading, or other types of advice or recommendations supplied or endorsed by TradingView. Read more in the Terms of Use.