
Looking at only one timeframe can show you the structure.
Looking at multiple timeframes can show you the structure within the structure.
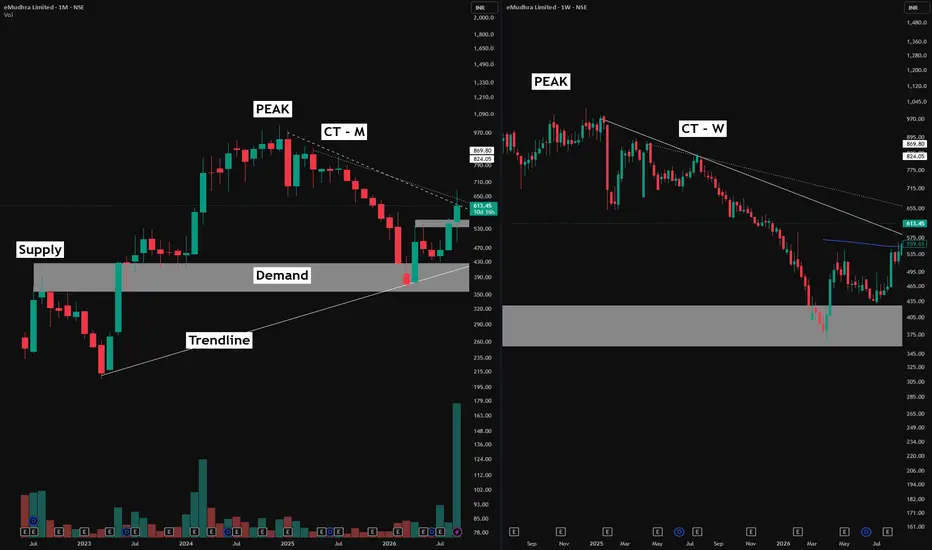
This historical chart compares the Monthly and Weekly timeframes to demonstrate how market peaks, supply-demand transitions and counter-trendlines can appear differently depending on how closely we examine price.
An area that previously acted as Supply can later become relevant as Demand when price returns to it from above. The zone hasn't physically changed, what has changed is the way price interacts with that area after moving through it.
Notice what happens when price eventually revisits this region.
The old supply area overlaps with the broader demand structure, while the long-term rising trendline also reaches approximately the same region.
Now add another layer: CT-M.
CT-M = Monthly Counter-Trendline.
It connects the declining structure developing after the major peak. On the monthly chart, this counter-trendline compresses a very large amount of price action into what appears to be one relatively simple descending structure.
But switch to the Weekly timeframe, and the picture becomes much more detailed.
The same broader decline contains additional swings, reactions and intermediate structures that were difficult to see on the monthly chart.
Here we have CT-W — the Weekly Counter-Trendline.
CT-W tracks the declining structure using weekly price action, while CT-M represents that same broader phase from the higher-timeframe perspective.
And that is the purpose of Multi-Timeframe Analysis.
It isn't about finding two different stories.
It is about examining the same market structure at different levels of resolution.

📊Swing & positional equity research with Buy, Sell and Hold recommendations.
Contact
📞WhatsApp: wa.me/919455664601
💬Telegram DM: t.me/Apoorv_HH
📢Join Telegram channel: t.me/hashtaghammer
Apoorv Dubey|SEBI RA INH000030287
Contact
📞WhatsApp: wa.me/919455664601
💬Telegram DM: t.me/Apoorv_HH
📢Join Telegram channel: t.me/hashtaghammer
Apoorv Dubey|SEBI RA INH000030287
Related publications
Disclaimer
The information and publications are not meant to be, and do not constitute, financial, investment, trading, or other types of advice or recommendations supplied or endorsed by TradingView. Read more in the Terms of Use.