
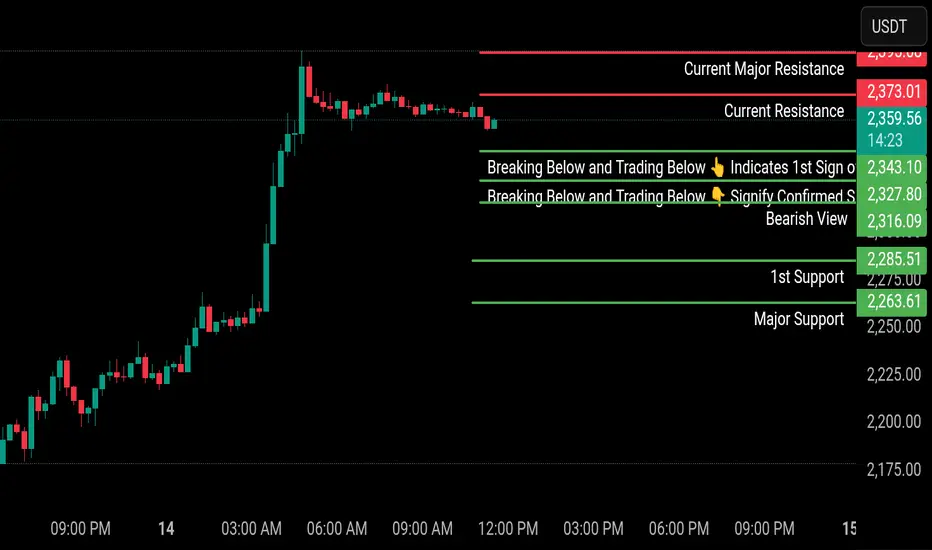
ETH Market Analysis (15M) — Early Weakness Under Resistance with Defined Breakdown Triggers
The market is currently trading just below a stacked resistance zone, and the structure is showing signs of exhaustion after an initial bullish push. Price is no longer trending aggressively upward and is now stabilizing under resistance, which indicates a transition into a decision phase.
Key Resistance Structure
1. Current Resistance — 2,373.01
Immediate barrier
Price is unable to sustain above this level
Indicates:
Weak continuation
Sellers actively defending
2. Current Major Resistance — 2,395.08
Upper supply zone
Acts as:
Final barrier before any bullish expansion
Without strong acceptance above this:
Upside remains limited
Weakness Confirmation Levels (Critical Insight from Chart)
3. First Sign of Weakness — 2,343.10
Marked clearly as:
Breaking below and trading below indicates first sign of weakness
If price trades below this:
Early indication that:
Buyers are losing control
Momentum is shifting
4. Confirmed Weakness Level — 2,327.80
Marked as:
Breaking below and trading below signifies confirmed sign of weakness
This is the key trigger:
Below this:
Market bias turns bearish on 15M
Downside continuation becomes probable
5. Bearish Reference Level — 2,316.09
Acts as:
Confirmation zone for sustained weakness
Holding below this:
Reinforces bearish structure
Support Structure
6. 1st Support — 2,285.51
First downside target
Likely reaction zone after breakdown
7. Major Support — 2,263.61
Strong demand zone
Acts as:
Final downside objective within current structure
Potential reaction area
Structural Interpretation
Market phase:
Bullish impulse → Resistance → Weak consolidation
Current behavior:
Price is compressing under resistance
No breakout strength visible
Scenario-Based Breakdown
Bullish Scenario (Low Probability Unless Proven)
Condition:
Price reclaims and sustains above 2,373
Then:
Move toward:
2,395
Further continuation requires:
Strong acceptance above major resistance
Weakness → Bearish Scenario (Primary Read from Chart)
Step 1:
Break below 2,343 → Early weakness
Step 2:
Break below 2,327 → Confirmed weakness
Then:
Market likely moves toward:
2,285
2,263
Order Flow Insight
The initial bullish move is:
Not being continued
Current structure shows:
Supply absorption failure
Sellers stepping in near resistance
Critical Insight
The market is not bearish yet — but it is clearly showing signs of weakness
Weakness is level-dependent, not assumption-based
Confirmation only occurs:
Below 2,327
Conclusion
ETH is currently in a resistance-led compression phase
The structure is clearly defined:
Above 2,373 → continuation attempt
Below 2,343 → weakness begins
Below 2,327 → bearish confirmation
Until these levels are broken:
Market remains range-bound under resistance with downside risk building

Disclaimer
The information and publications are not meant to be, and do not constitute, financial, investment, trading, or other types of advice or recommendations supplied or endorsed by TradingView. Read more in the Terms of Use.
Disclaimer
The information and publications are not meant to be, and do not constitute, financial, investment, trading, or other types of advice or recommendations supplied or endorsed by TradingView. Read more in the Terms of Use.