Technical Analysis – Daily Chart Overview
🔷 Pattern Structure: Symmetrical Triangle Breakout
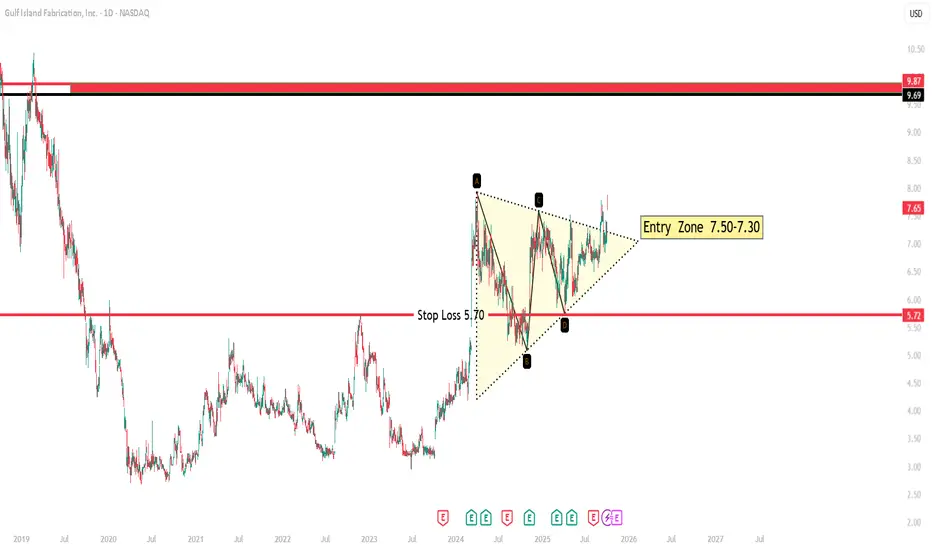
The stock has formed a symmetrical triangle pattern, marked by points A-B-C-D, typically signaling a continuation or breakout move.
The recent breakout above the triangle's resistance trendline indicates a bullish momentum shift.
🟨 Entry Zone: $7.30 – $7.50
Price is currently in the highlighted entry zone, which aligns closely with the triangle breakout level.
This area offers a high-probability entry for traders looking to catch a move early after consolidation.
The volume confirmation (not shown but assumed based on pattern behavior) would strengthen this breakout’s reliability.
📉 Stop Loss: $5.70
A logical stop-loss level is placed below the recent swing low and the lower triangle support.
$5.70 marks invalidation of the bullish structure, minimizing downside risk if the breakout fails.
This also protects against a false breakout or retest failure.
🎯 Target Zone: $9.69 – $9.87
The next significant resistance level lies in the range of $9.69 to $9.87, a strong supply zone from 2018–2019.
If momentum continues, price could revisit this zone, offering a potential upside of ~28%–32% from current levels.
🔧 Technical Summary
Component Level/Zone Observation
Pattern Symmetrical Triangle Breakout confirms bullish bias
Entry Zone $7.30 – $7.50 Ideal buy zone after breakout
Stop Loss $5.70 Below pattern low – risk management level
Target Zone $9.69 – $9.87 Previous major resistance – potential profit area
Bias Bullish Post-breakout structure with volume confirmation
📌 Conclusion
Gulf Island Fabrication (GIFI) is showing strong bullish signs after a textbook triangle breakout, with clean support and resistance levels. The risk-to-reward ratio is favorable, especially with a tight stop and a clearly defined target zone.
This setup is suitable for swing traders or position traders looking to capitalize on medium-term momentum. Monitoring volume and price action around the $8.00 level will be key to gauging the strength of the breakout continuation.
🔷 Pattern Structure: Symmetrical Triangle Breakout
The stock has formed a symmetrical triangle pattern, marked by points A-B-C-D, typically signaling a continuation or breakout move.
The recent breakout above the triangle's resistance trendline indicates a bullish momentum shift.
🟨 Entry Zone: $7.30 – $7.50
Price is currently in the highlighted entry zone, which aligns closely with the triangle breakout level.
This area offers a high-probability entry for traders looking to catch a move early after consolidation.
The volume confirmation (not shown but assumed based on pattern behavior) would strengthen this breakout’s reliability.
📉 Stop Loss: $5.70
A logical stop-loss level is placed below the recent swing low and the lower triangle support.
$5.70 marks invalidation of the bullish structure, minimizing downside risk if the breakout fails.
This also protects against a false breakout or retest failure.
🎯 Target Zone: $9.69 – $9.87
The next significant resistance level lies in the range of $9.69 to $9.87, a strong supply zone from 2018–2019.
If momentum continues, price could revisit this zone, offering a potential upside of ~28%–32% from current levels.
🔧 Technical Summary
Component Level/Zone Observation
Pattern Symmetrical Triangle Breakout confirms bullish bias
Entry Zone $7.30 – $7.50 Ideal buy zone after breakout
Stop Loss $5.70 Below pattern low – risk management level
Target Zone $9.69 – $9.87 Previous major resistance – potential profit area
Bias Bullish Post-breakout structure with volume confirmation
📌 Conclusion
Gulf Island Fabrication (GIFI) is showing strong bullish signs after a textbook triangle breakout, with clean support and resistance levels. The risk-to-reward ratio is favorable, especially with a tight stop and a clearly defined target zone.
This setup is suitable for swing traders or position traders looking to capitalize on medium-term momentum. Monitoring volume and price action around the $8.00 level will be key to gauging the strength of the breakout continuation.
Trade active
achivedDisclaimer
The information and publications are not meant to be, and do not constitute, financial, investment, trading, or other types of advice or recommendations supplied or endorsed by TradingView. Read more in the Terms of Use.
Disclaimer
The information and publications are not meant to be, and do not constitute, financial, investment, trading, or other types of advice or recommendations supplied or endorsed by TradingView. Read more in the Terms of Use.