Timeframe: 4H
Bias: Potential Bullish Reversal
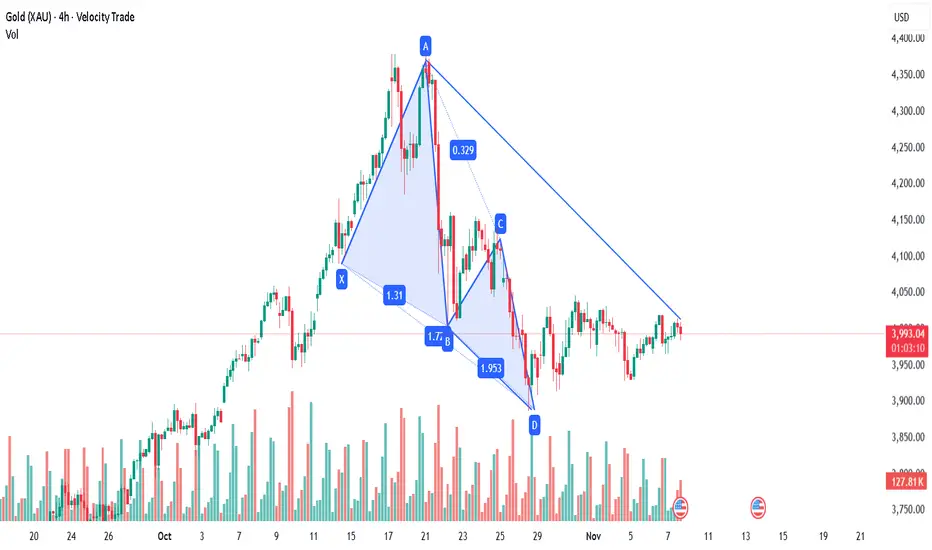
Pattern: Harmonic (Possibly a Bat like structure)
Current Price: Around 3,985
On this chart, Gold has formed a clear X-A-B-C-D harmonic structure, with the final leg (D) completing near a strong support zone around 3,850–3,870.
This zone has already been tested once, and price reacted sharply upward from there — which suggests buyers stepped in to defend that area.
Currently, Gold is sitting just below the descending trendline that connects points A and C.
This line is key — if we see a breakout above it, it could signal the start of a trend reversal or at least a short-term bullish move toward 4,100+.
Bias: Potential Bullish Reversal
Pattern: Harmonic (Possibly a Bat like structure)
Current Price: Around 3,985
On this chart, Gold has formed a clear X-A-B-C-D harmonic structure, with the final leg (D) completing near a strong support zone around 3,850–3,870.
This zone has already been tested once, and price reacted sharply upward from there — which suggests buyers stepped in to defend that area.
Currently, Gold is sitting just below the descending trendline that connects points A and C.
This line is key — if we see a breakout above it, it could signal the start of a trend reversal or at least a short-term bullish move toward 4,100+.
Disclaimer
The information and publications are not meant to be, and do not constitute, financial, investment, trading, or other types of advice or recommendations supplied or endorsed by TradingView. Read more in the Terms of Use.
Disclaimer
The information and publications are not meant to be, and do not constitute, financial, investment, trading, or other types of advice or recommendations supplied or endorsed by TradingView. Read more in the Terms of Use.