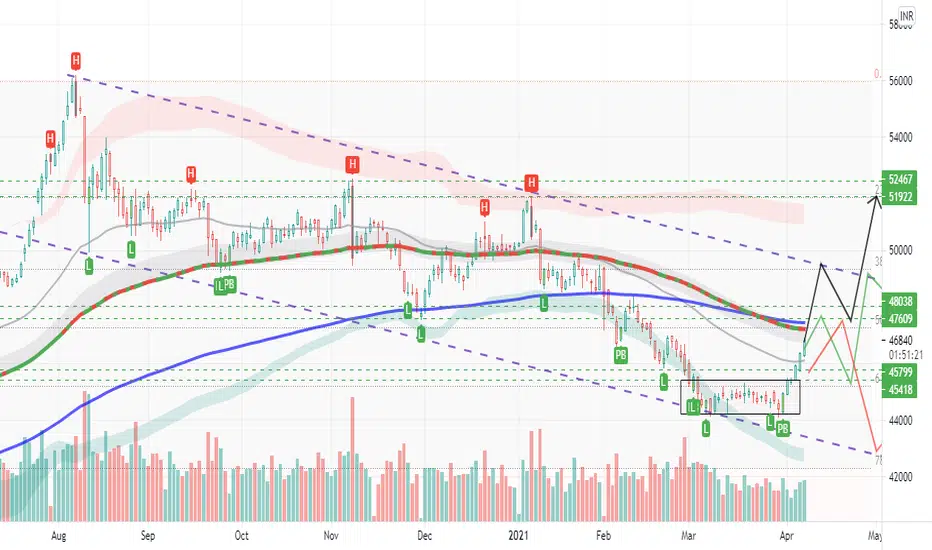
The Indicator Used:
1) TE-REKAB - Proprietary Indicator
KEYS:
PB: Pullback
H/Blue Candle: Selling Divergence
L/Yellow Candle: Buying Divergence
2) Daily Lines Plots Daily 50 EMA (GREY) & BLUE (200 DAILY EMA ) On Lower Time Frame Charts.
3) Valuation band
KEYS: Red Faded Cloud: Over Valuation.
Grey Faded Cloud: Proper Valuation.
Green Faded Cloud: Under Valuation.
PANEL 2:
Related publications
Disclaimer
The information and publications are not meant to be, and do not constitute, financial, investment, trading, or other types of advice or recommendations supplied or endorsed by TradingView. Read more in the Terms of Use.
Related publications
Disclaimer
The information and publications are not meant to be, and do not constitute, financial, investment, trading, or other types of advice or recommendations supplied or endorsed by TradingView. Read more in the Terms of Use.