
1. The Macro Perspective: The Boom, The Bust, and The Base
I am taking a LONG bias on Graphite India Limited (GRAPHITE) on the absolute macro monthly (1M) timeframe.
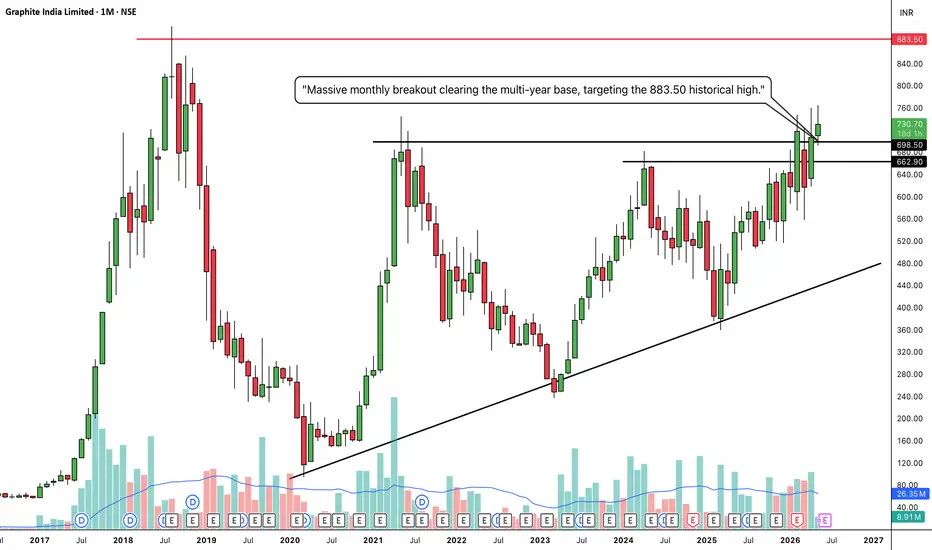
When analyzing pure market structure on a monthly chart, we are looking at the true footprints of heavy institutional capital playing out over years. Look at the massive structural development on this chart. In 2018, the stock established its ultimate historical ceiling at the solid red 883.50 line. What followed was a brutal, multi-year markdown phase that completely decimated weak hands. However, instead of bleeding into a permanent bear market, the stock found an absolute floor in 2020. For the last four years, the stock has been quietly carving out a massive accumulation phase, systematically grinding its way back up the chart.
2. The Educational Setup: The Ascending Pressure Cooker
To understand the sheer strength of this current breakout, look at how the price systematically squeezed historical resistance to form a textbook macro "Ascending Triangle":
The Dual Ceilings: The stock's recovery was heavily capped by a formidable dual-resistance zone consisting of the solid black lines at 662.90 and 698.50.
The Aggressive Trendline: Notice the defining feature of this right-side recovery: the steep, unbroken ascending trendline originating from the 2020 lows. Every time the stock pulled back from the black resistance lines, institutional buyers stepped in earlier and earlier, forming a beautiful sequence of higher lows.
The Squeeze: By aggressively pressing up against the horizontal ceilings while forming higher lows, the stock acted like the ultimate pressure cooker. It squeezed short-sellers and transferred millions of shares to strong-handed buyers, storing immense kinetic energy for the final launch.
3. Current Price Action: Entering the Price Vacuum
Look at the most recent monthly candle on the far right. The multi-year pressure cooker has absolutely exploded. Buyers have effortlessly shattered both the 662.90 and 698.50 macro ceilings with a massive, full-bodied green momentum thrust. By decisively clearing this multi-year accumulation zone, GRAPHITE has officially confirmed a secular trend shift. More importantly, it has entered a "Price Vacuum." Looking to the left, there is very little structural resistance between the current price and the ultimate red 883.50 level.
4. The Trade Plan: Entries, Targets, and Risk Management
Entry Strategy: Momentum is exceptionally strong right now near 731.30. Because this is a monthly breakout, chasing a massive vertical expansion candle on smaller timeframes carries a higher risk of agonizing drawdowns. The highest-probability, lowest-risk entry involves stepping down to a weekly or daily timeframe and waiting for the dust to settle. Look to place limit orders to catch a potential structural pullback to retest the 680.00 to 700.00 breakout zone. Letting those years of heavy resistance prove themselves as a new, indestructible support floor offers a phenomenal risk-to-reward ratio.
Take Profit (Targets): The primary macro target is undeniable: the massive red historical resistance line sitting at 883.50. The stock is attempting to complete a massive, multi-year round trip to fill that void.
Invalidation (Stop Loss): A macro trade thesis is only valid if the new market structure holds. A hard stop loss should be placed safely below the recent monthly accumulation and the ascending trendline, ideally near the dashed 550.85 mid-level pivot. A definitive monthly close completely back inside the old base and below 600.00 would invalidate the immediate continuation thesis and signal a severe macro bull trap.
5. Time Horizon:
Because this technical setup is built on a 1-Month chart capturing a massive, multi-year structural phase transition, this is a long-term position trade/investment designed to capture a secular markup phase that could play out over several quarters. Let the macro trend run!
Trade closed: stop reached
Price crashed after fake breakout.
Disclaimer
The information and publications are not meant to be, and do not constitute, financial, investment, trading, or other types of advice or recommendations supplied or endorsed by TradingView. Read more in the Terms of Use.
Disclaimer
The information and publications are not meant to be, and do not constitute, financial, investment, trading, or other types of advice or recommendations supplied or endorsed by TradingView. Read more in the Terms of Use.