
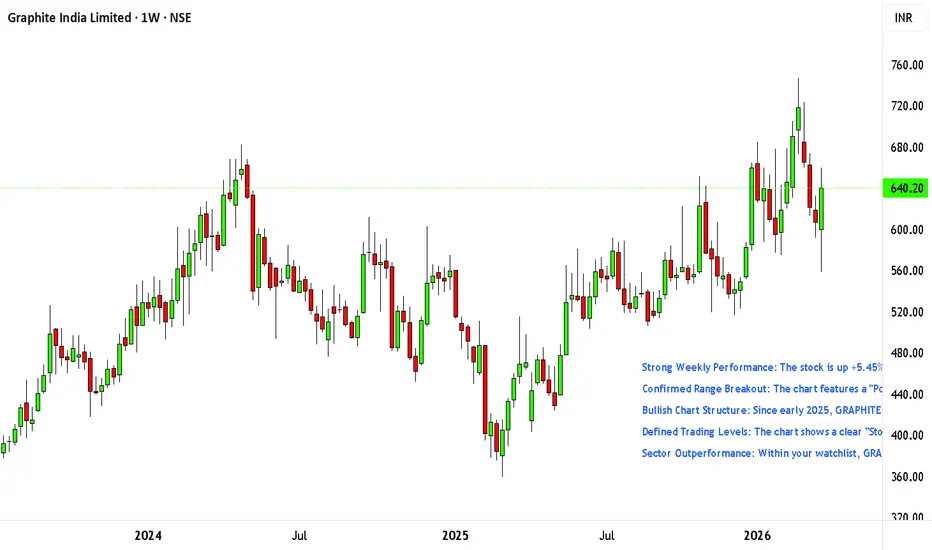
Strong Weekly Performance: The stock is up +5.45% for the week (currently at 640.20), showing significant recovery from its weekly low of 558.05.
Confirmed Range Breakout: The chart features a "Positional Swing" note pointing to a Range Breakout above the 580 level; the price is now comfortably holding above this previous resistance, which has turned into support.
Bullish Chart Structure: Since early 2025, GRAPHITE has transitioned from a downtrend into a steady uptrend, characterized by "higher highs" and "higher lows," with the current move targeting the 52-week high of 747.00.
Defined Trading Levels: The chart shows a clear "Stop Loss" zone marked in red near 351.65, while immediate horizontal support is established at 436.95.
Sector Outperformance: Within your watchlist, GRAPHITE (+7.46%) and its peer HEG (+13.75%) are leading the market, suggesting strong sectoral tailwinds for graphite electrode manufacturers despite the broader Nifty weakness.

Automated Tools/Indicators/Screeners available at kkonline.org/nimblrta
Disclaimer
The information and publications are not meant to be, and do not constitute, financial, investment, trading, or other types of advice or recommendations supplied or endorsed by TradingView. Read more in the Terms of Use.