
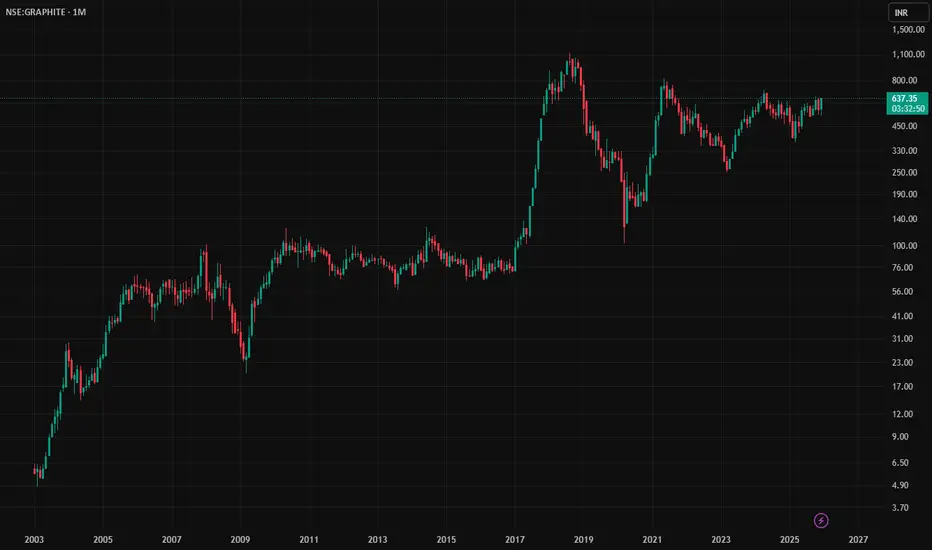
📈 Understanding Symmetrical Triangle Breakout in Grahipte India Ltd
Grahipte India Limited, currently trading near ₹438 on the monthly chart, has recently shown a sustained bullish breakout from a symmetrical triangle pattern. This setup is a classic continuation signal in technical analysis, especially when it occurs within an established uptrend. Let’s break down the concept, its importance, and the current opportunity with risk management considerations.
🔺 What is a Symmetrical Triangle Pattern?
Definition: A symmetrical triangle is formed when price action creates lower highs and higher lows, converging into a triangle shape.
Psychology: It reflects a period of consolidation where buyers and sellers are in equilibrium.
Breakout Direction: The eventual breakout (upward or downward) signals the next major move.
Volume Factor: A valid breakout is often accompanied by rising volume, confirming institutional participation.
🌟 Importance in an Uptrend
Continuation Signal: In an ongoing uptrend, a symmetrical triangle usually acts as a pause before continuation.
Bullish Breakout: When price breaks above the upper trendline, it indicates renewed buying interest and potential for further upside.
Market Sentiment: The breakout shows that buyers have absorbed selling pressure and are ready to push prices higher.
⚖️ Risk Management Criteria
Even strong breakouts require disciplined risk management:
Entry Zone: After a sustained breakout, traders often enter near the breakout level
Stop-Loss Placement: Below the lower trendline or recent swing low to protect against false breakouts.
Position Sizing: Allocate capital based on risk tolerance (e.g., risking 1–2% of portfolio per trade).
Confirmation: Look for monthly close above breakout zone with volume support before aggressive positioning.
📊 Current Opportunity in Grahipte India Ltd
Trend Context: The stock is in a monthly uptrend, and the breakout from the symmetrical triangle strengthens the bullish case.
Upside Potential: Based on technical projection, the height of the triangle can be added to the breakout point to estimate targets.
📝 Final Takeaway
The symmetrical triangle breakout in Grahipte India Ltd is a textbook example of consolidation followed by continuation in an uptrend. While the breakout offers a bullish opportunity, traders should respect risk management rules—enter near breakout levels, keep stops tight, and aim for logical targets.

Disclaimer
The information and publications are not meant to be, and do not constitute, financial, investment, trading, or other types of advice or recommendations supplied or endorsed by TradingView. Read more in the Terms of Use.
Disclaimer
The information and publications are not meant to be, and do not constitute, financial, investment, trading, or other types of advice or recommendations supplied or endorsed by TradingView. Read more in the Terms of Use.