
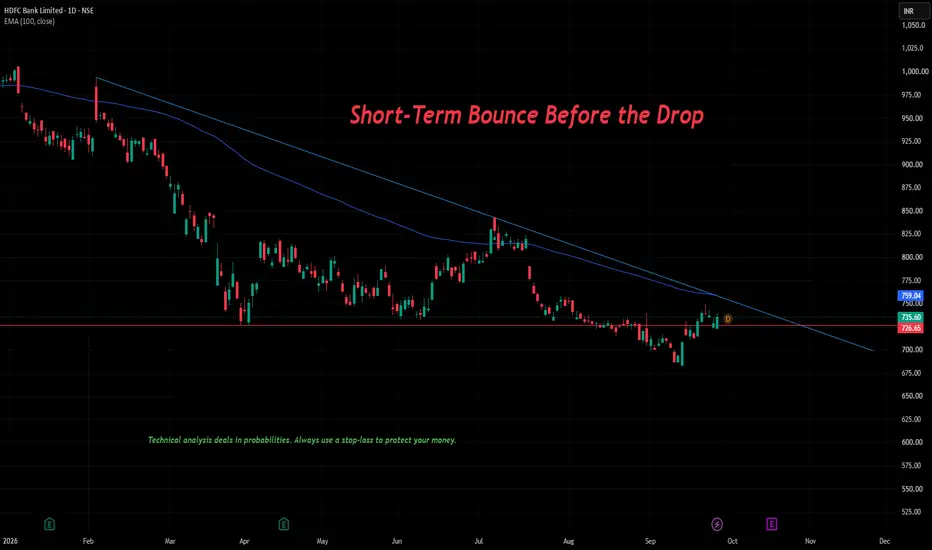
HDFC Bank (currently at 735.60) is in a clear daily downtrend. However, expect a small recovery bounce before the sellers take over again.
The Setup:
The Ceiling (Resistance): The price is likely moving up toward the falling blue trendline in the 755 – 760 zone. This area also lines up with the 100-day moving average (759.04), creating a very strong wall for buyers.
Trade Plan: "Sell on the rise." Wait for the price to hit the 755 – 760 area. If it stops going up and starts falling from there, enter a sell (short) trade.
Target: Ride the drop back down to recent lows near 720.
Stop-Loss: Exit your trade if the daily price closes above 765. If it breaks above the blue line, the downtrend is over.
Disclaimer: Technical analysis deals in probabilities. Always use a stop-loss to protect your money.

Disclaimer
The information and publications are not meant to be, and do not constitute, financial, investment, trading, or other types of advice or recommendations supplied or endorsed by TradingView. Read more in the Terms of Use.
Disclaimer
The information and publications are not meant to be, and do not constitute, financial, investment, trading, or other types of advice or recommendations supplied or endorsed by TradingView. Read more in the Terms of Use.