
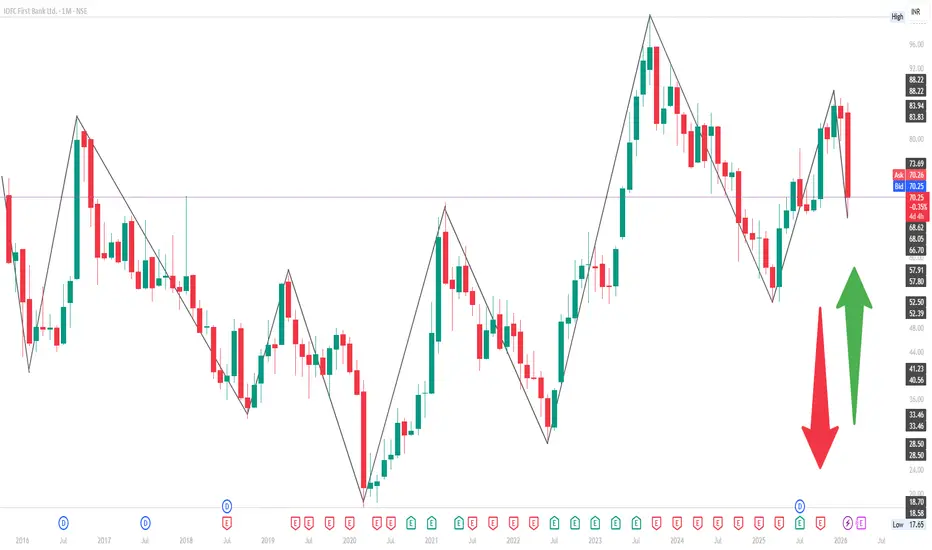
📉 Recent Price Context
The stock recently plunged sharply (up to 20%) after fraud disclosure news, hitting lower circuit near ~₹67-70 range.
This means yesterday’s price action reset many short-term setups and made prior levels less reliable until consolidation stabilizes.
📊 Key 1-Month Technical Levels
🔹 Resistance (Upside)
These are levels where price may face selling pressure if it attempts to recover:
~₹77–78 – Initial resistance zone from recent swing high attempts.
~₹81–83 – Mid-term resistance area (previous pivot/average area).
~₹85–87 – Upper resistance near recent 52-week highs from prior trend history.
These resistance points are derived from historical pivot points, SMA levels, and prior recent price clustering before today’s plunge.
🔸 Support (Downside)
Important zones where price may find demand / bounce:
~₹67 – Short-term support and recent low (lower circuit).
~₹64–66 – Next support band from the 52-week range lows.
~₹60 – Psychological deeper support if panic selling continues (approx).
📌 Pivot Reference Areas
Some pivot and classic technical levels that were noted before extreme volatility:
Pivot point ~₹82–83
Classic support 1 ~₹80
Classic resistance 1 ~₹86-87
These help in identifying potential intraday/intra-week balance zones once trading stabilizes.
📈 Technical Indicator Context
Even before recent sharp moves:
Oscillators indicated a mixed/neutral to bearish tone on the short term.
Pivot and moving average pivot zones were signalling price congestion near ~₹80-83 zones.
This means the trend was choppy near the current price range even before the plunge. Combined with news-driven volatility, levels may shift quickly as markets digest developments.
⚠️ Important Note
The recent sharp 20% drop driven by reported fraud issues has created extreme volatility and may invalidate many pre-existing technical patterns and pivots until volatility subsides.
If you’re using these levels for intraday or short-term trading, watch for new consolidation and volume confirmation first before relying heavily on old pivot/resistance metrics.

Related publications
Disclaimer
The information and publications are not meant to be, and do not constitute, financial, investment, trading, or other types of advice or recommendations supplied or endorsed by TradingView. Read more in the Terms of Use.
Related publications
Disclaimer
The information and publications are not meant to be, and do not constitute, financial, investment, trading, or other types of advice or recommendations supplied or endorsed by TradingView. Read more in the Terms of Use.