________________________________________
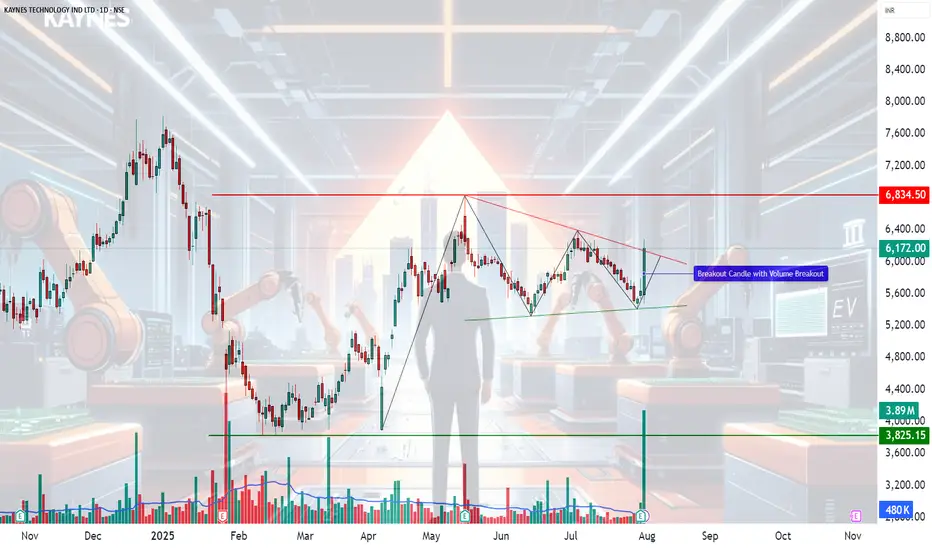
🧠 KAYNES TECHNOLOGY IND LTD – Technical Analysis
Ticker: NSE:KAYNES | Sector: EMS & Semiconductors
Current Price: 6,172.00 ▲ (+9.5% on July 31, 2025)
Technical View: ⭐⭐⭐⭐ | Chart Pattern: Falling Wedge Breakout
________________________________________
📈 Technical Overview
🔹 Chart Pattern Formed: Falling Wedge Breakout with extremely high volume confirmation
🔹 Breakout Zone: 6,000–6,050
🔹 Momentum Signals:
— RSI breakout above 60
— Strong bullish candle with rising volume
— VWAP and SuperTrend aligned bullish
🔹 Support Trendline Held on multiple touchpoints
🔹 Breakout Candle marked by heavy institutional volume
________________________________________
📰 Key Fundamental Developments
✅ Q1 FY26 PAT up ~50% YoY to 74.6 Cr
✅ Gross margin expanded to 41%, EBITDA margin to 16.8%
✅ Strategic acquisitions from Fujitsu (85 Cr domestic + 118 Cr JV with L&T)
✅ Strong order book visibility (~7,400 Cr)
✅ Raised 1,600 Cr via QIP to fund growth
________________________________________
📊 Sentiment Analysis
Sentiment: ✅ Positive
— Strong earnings beat and margin expansion
— Global expansion through Fujitsu JV
— Bullish commentary from major brokerages
— Institutional confidence via QIP and upgrades
________________________________________
🔼 Resistance Levels
6,400 – Immediate breakout target
6,834 – Top of consolidation range
7,285 – Medium-term resistance (historic supply zone)
🔽 Support Levels
5,970 – Breakout retest zone
5,700 – Structure base
5,170 / 4,864 – Deep support for longer-term invalidation
________________________________________
📌 What’s Catching Our Eye
🔹 Volume spike confirms genuine breakout
🔹 RSI, SuperTrend, VWAP – all flashing bullish
🔹 Back-to-back bullish closes after a 10 day contraction breakout
🔹 Volume & price action aligned across multiple timeframes
________________________________________
👀 What We’re Watching For
🔸 Follow-through momentum toward 6,400+
🔸 Whether breakout holds above 5,970 in coming sessions
🔸 Semiconductor line execution progress
🔸 Margin trends in upcoming quarters
________________________________________
⚠️ Risks to Monitor
⚠️ Rich valuations (~130x P/E) – limited room for disappointment
⚠️ Execution risk on new lines and acquisitions
⚠️ Global slowdown in electronics & macro headwinds
⚠️ Any delay in semiconductor segment scale-up
________________________________________
🔮 What to Expect Next
🔹 Retest of breakout zone (~6,000–6,050) possible
🔹 If held, expect momentum toward 6,400–6,800
🔹 Sideways consolidation likely if volumes taper
🔹 Strong close above 6,400 could initiate fresh uptrend leg
________________________________________
📈 Strategy Insight (For Educational Purposes Only)
— Aggressive Traders: Watch level of 6284
— Momentum Traders: Watch 6,050 retest for low-risk entry
— Risk Management: Position sizing + Capital risk – as per individual preference
________________________________________
💬 Why It’s On Our Watchlist
Kaynes blends EMS scale with high-margin ODM design and semiconductor upside. Rare in India’s listed space. Strong revenue visibility, global expansions, and balance sheet strength make it a high-conviction long-term story.
________________________________________
📉 If Price Comes Down…
5,700–5,800 is a critical support zone. Breakdown below this with volume = trend weakness. 5,400 is final demand zone before structural damage.
________________________________________
🪙 Educational Insight for Learners
This chart is a real-world example of a falling wedge breakout confirmed by volume. The key takeaway: price alone is not enough—watch volume, RSI, and structure. Never chase momentum without a plan. Always pair conviction with discipline.
________________________________________
🚨 Reminder: No stock is a “sure thing.” Use proper risk management. Stay rational when others get emotional.
________________________________________
⚠️ Disclaimer (Please Read Carefully):
This content is shared strictly for educational and research purposes only.
I am not a SEBI-registered investment advisor, and no buy or sell recommendations are being made.
All views expressed are based on personal market analysis and experience. They are not intended as financial advice.
Trading — especially in derivatives like options — involves significant financial risk. Losses can exceed your initial investment.
👉 Always do your own research and consult a certified SEBI-registered advisor before making any investment or trading decisions.
👉 Use proper risk management and only trade with capital you can afford to lose.
The author assumes no responsibility or liability for any trading losses incurred from acting on this content.
By engaging with this material, you agree to these terms.
________________________________________
💬 Found this helpful?
Drop your thoughts, questions, or insights in the comments below ⬇️ — let’s learn together!
🔁 Share this post with your trading friends and community — help them discover clean charts, structured setups, and zone-based learning.
✅ Follow simpletradewithpatience for clear setups, educational content, and a no-nonsense approach to price action, supply-demand zones, and risk-managed trades.
🚀 Trade with patience. Trust your charts. Stay clear-headed.
Because the goal is not just to trade — it's to trade better.
Be Self-Reliant | Trade with Patience | Learn with Charts & Zones 📊
STWP | Mentor & Demand-Supply Specialist | Empowering traders through structured learning |
simpletradewithpatience.com
Community: chat.whatsapp.com/BEYz0tkqP0fJPBCWf59uel
wa.me/message/6IOPHGOXMGZ4N1
Educational Only
simpletradewithpatience.com
Community: chat.whatsapp.com/BEYz0tkqP0fJPBCWf59uel
wa.me/message/6IOPHGOXMGZ4N1
Educational Only
Disclaimer
The information and publications are not meant to be, and do not constitute, financial, investment, trading, or other types of advice or recommendations supplied or endorsed by TradingView. Read more in the Terms of Use.