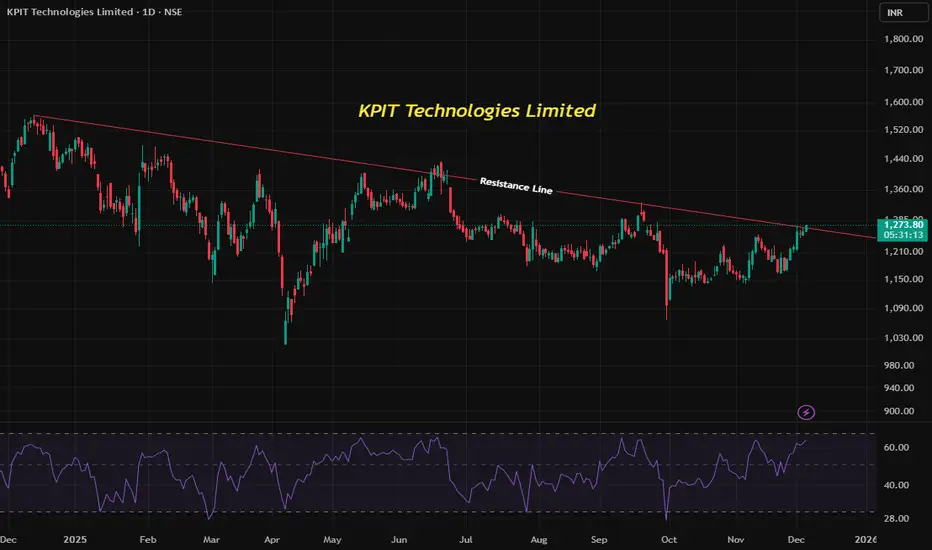
KPIT Technologies Ltd is currently trading near ₹1271 on the daily chart. The stock has been in a downtrend, forming lower highs and lower lows, but is now attempting a trend reversal by breaking out of its downtrend line. Alongside this, the RSI indicator has moved above 50, signaling renewed buying strength. Let’s break down these concepts and understand the current opportunity.
🔹 Understanding the Downtrend Pattern
1. Downtrend Definition: A downtrend is characterized by a sequence of lower highs and lower lows, showing persistent selling pressure.
2. Trendline Role: Traders often draw a descending trendline connecting the highs. As long as price stays below this line, the downtrend remains intact.
3. Reversal Signal: When price breaks above the downtrend line, it suggests that sellers are losing control and buyers may be taking over.
4. KPIT Example: The breakout above its downtrend line indicates a potential shift from bearish to bullish sentiment.
🔹 RSI Indicator as Momentum Confirmation
Relative Strength Index (RSI): A momentum oscillator ranging from 0–100.
Key Levels:
Below 50 → bearish momentum
Above 50 → bullish momentum
Why It Matters: RSI crossing above 50 often confirms that buying activity is strengthening.
KPIT Example: RSI moving above 50 supports the breakout, adding conviction that the trend reversal is genuine.
🔹 Combining Downtrend Breakout with RSI
Dual Confirmation:
1. Breakout of the downtrend line → structural change in price action.
2. RSI above 50 → momentum shift toward buyers.
Why This Combination Works: It reduces false signals. A breakout alone may fail, but when supported by momentum indicators, the probability of success increases.
🔹 Current Trading Opportunity
Setup:
1. Entry: Near current levels (~₹1271), as price has broken the downtrend line.
2. Stop Loss: Below the most recent swing low, ensuring risk is defined if reversal fails.
3. Target: Traders often aim for the next resistance zone or use trailing stops to capture extended moves.
Risk Management:
1. Always define risk before entering.
2. Use the pullback low or recent swing low as a stop loss.
3. Adjust position size to maintain favorable reward-to-risk ratio.
📌 Key Takeaways
1. A downtrend reversal occurs when price breaks above its descending trendline.
2. RSI above 50 confirms momentum is shifting toward buyers.
3. Combining structural breakout with momentum confirmation creates a stronger trading signal.
4. Using the recent swing low as stop loss ensures disciplined risk management.
KPIT Technologies’ current setup is a textbook example of how traders can use trendline breakouts and RSI momentum together to identify potential reversals. It highlights the importance of combining price action with indicators to build a structured trading plan.
Disclaimer
The information and publications are not meant to be, and do not constitute, financial, investment, trading, or other types of advice or recommendations supplied or endorsed by TradingView. Read more in the Terms of Use.
Disclaimer
The information and publications are not meant to be, and do not constitute, financial, investment, trading, or other types of advice or recommendations supplied or endorsed by TradingView. Read more in the Terms of Use.