
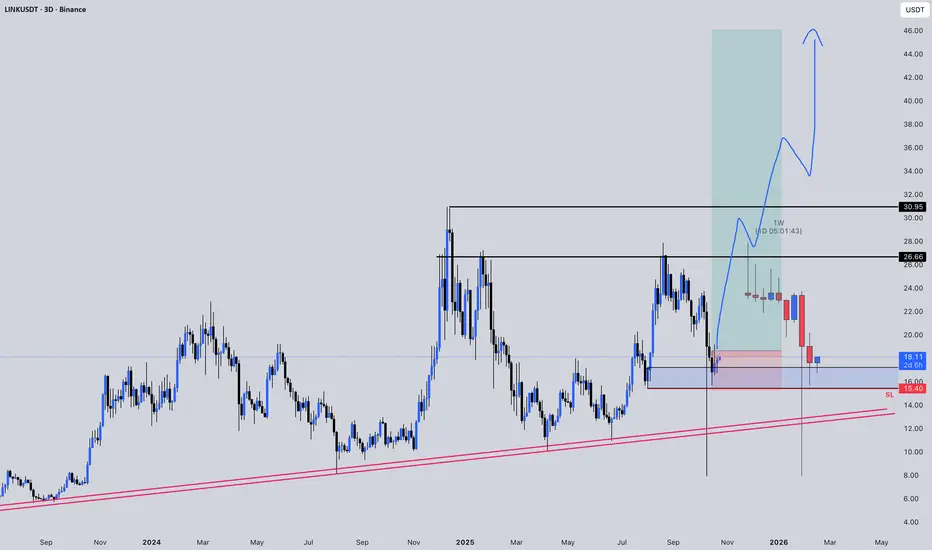
LINK has pulled back into a strong demand zone between $15.4–$16, aligning perfectly with the ascending trendline support that has held since mid-2023.
The recent wick rejection shows early signs of demand returning — if price holds above this area, we could see a potential mid-term reversal forming.
⸻
📊 Technical Outlook:
• 🔹 Structure: Still maintaining a higher-low formation on 3D
• 🔹 Support Zone: $15.4–$16 — key area for continuation
• 🔹 Trendline Support: Multi-touch ascending trendline intact
• 🔹 RSI: Neutral, room for upside momentum
• 🎯 Targets:
• TP1 → $30
• TP2 → $50
• ❌ Invalidation: 3D close below $15.4
⸻
📈 Bias: Bullish reversal setup – accumulation zone holding strong
🕓 Timeframe: 6 to 9 months

AR LABS ⚡️
Official TG Channel: t.me/arfxlabsofficial
Official TG Channel: t.me/arfxlabsofficial
Related publications
Disclaimer
The information and publications are not meant to be, and do not constitute, financial, investment, trading, or other types of advice or recommendations supplied or endorsed by TradingView. Read more in the Terms of Use.