
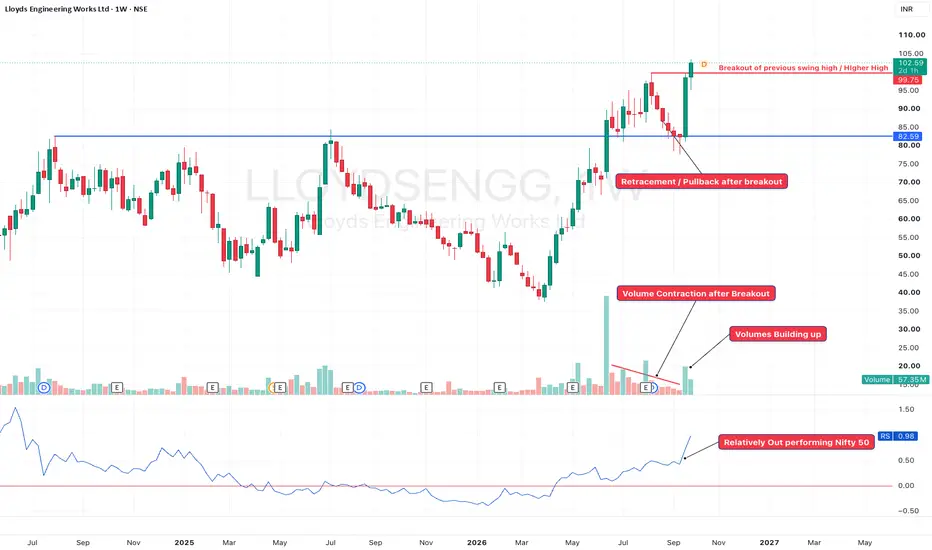
#LLOYDSENGG 🔥
**A clean example of a Breakout → Retracement → Continuation setup!**
One of the patterns I like watching after a breakout is how the stock behaves during the **first pullback**.
In LLOYDSENGG, the structure was quite interesting:
📌 **Step 1 – Breakout**
Price moved above an important resistance zone, indicating that buyers were willing to push the stock into a new price range.
📌 **Step 2 – Small Retracement**
Instead of immediately falling back into the previous range, the stock made a relatively controlled pullback.
📌 **Step 3 – Breakout Level Holds**
This is the important part.
The previous resistance area started acting as **support**. Price respected this zone instead of completely negating the breakout.
📌 **Step 4 – Continuation**
After holding the breakout zone, price started moving higher and is now breaking the previous swing high.
That gives us a very clean price-action sequence:
**Breakout 🚀 → Pullback ↘️ → Support Hold 🛡️ → Swing High Breakout 🚀**
The key lesson here is that **the breakout itself is only one part of the setup.**
The reaction after the breakout can often tell us whether the move has acceptance or whether it was simply a false breakout.
In a healthy breakout-retracement setup, I would generally look for:
✅ Shallow/controlled retracement
✅ Breakout zone holding as support
✅ No major selling pressure
✅ Higher low formation
✅ Fresh volume expansion during continuation
✅ Break above the previous swing high
LLOYDSENGG is an interesting chart to keep on the radar as an example of this price-action structure. Recent trading also saw a significant volume expansion accompanying the move.
**This is exactly the kind of price action momentum traders should learn to identify — not just chase the breakout.**
What do you think? 👀
**Are you tracking LLOYDSENGG for the next leg?**
#LLOYDSENGG #Breakout #BreakoutRetest #PriceAction #MomentumTrading #SwingTrading #StockMarketIndia #NSE #TechnicalAnalysis #ChartMomentum

Related publications
Disclaimer
The information and publications are not meant to be, and do not constitute, financial, investment, trading, or other types of advice or recommendations supplied or endorsed by TradingView. Read more in the Terms of Use.
Related publications
Disclaimer
The information and publications are not meant to be, and do not constitute, financial, investment, trading, or other types of advice or recommendations supplied or endorsed by TradingView. Read more in the Terms of Use.