
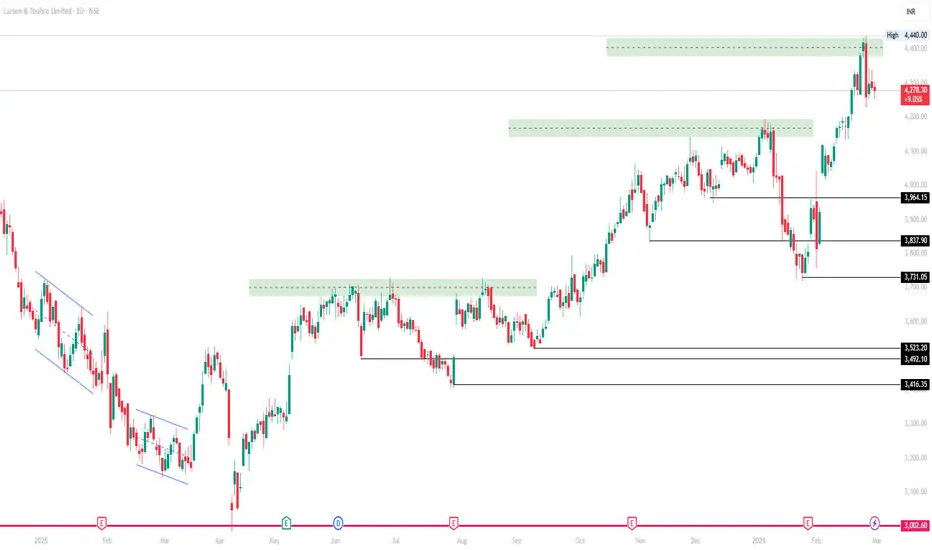
📌 Current Price Context (latest known)
Last price around ₹4,278–₹4,280 on NSE/BSE.
📍 1‑Day Intraday Support & Resistance Levels
These levels are typically used by day traders to gauge where price might pause, reverse, or breakout:
Resistance Levels (Upside)
R1: ~₹4,344
R2: ~₹4,389
R3: ~₹4,434
Above these, the next barriers are near recent swing highs around the 4,400+ zone.
Pivot (Critical Medium‑Term Level)
Pivot: ~₹4,300
Price above pivot suggests slight bullish bias; below suggests more weakness.
Support Levels (Downside)
S1: ~₹4,255
S2: ~₹4,210
S3: ~₹4,165
More significant support zones lie lower near the 4,038–3,900 range if price drops sharply.
Intraday Range (Recent)
Day Low: ~₹4,254
Day High: ~₹4,304
Range shows volatility within ~₹50‑₹60 on the session.
📊 Interpreting These Levels
Bullish breakout potential: A sustained move above R1 ~₹4,344 (and further above R2/R3) can indicate strength and continuation of recent uptrend.
Neutral to range‑bound: If price stays around the pivot (~₹4,300) and between S1/R1, expect sideways action.
Bearish tilt: A drop below S1 and especially S2/S3 can signal short‑term selling pressure in the session. Below ~₹4,038 then broader support zones kick in.

Related publications
Disclaimer
The information and publications are not meant to be, and do not constitute, financial, investment, trading, or other types of advice or recommendations supplied or endorsed by TradingView. Read more in the Terms of Use.
Related publications
Disclaimer
The information and publications are not meant to be, and do not constitute, financial, investment, trading, or other types of advice or recommendations supplied or endorsed by TradingView. Read more in the Terms of Use.