MANORAMA INDUSTRIES LTD (Daily Chart)
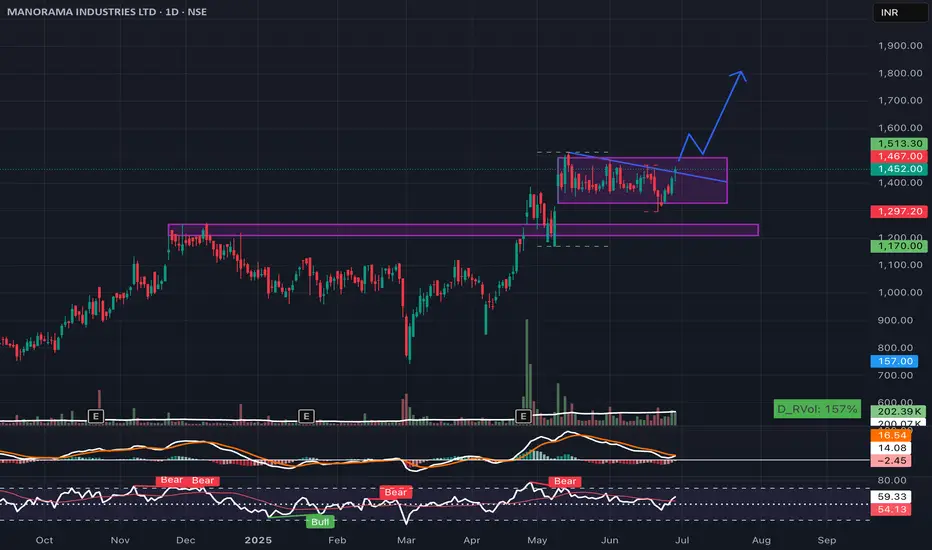
🟣 Chart Pattern: Bullish Pennant / Triangle
🟦 Box Zone: Strong support at ₹1300
📉 Downward trendline resistance being tested
📈 Price breakout above trend line today
📊 MACD shows potential bullish crossover
📈 RSI rising from mid-50s zone → strength building
📉 Volume rising slightly → needs confirmation for big breakout
Summary:
Manorama is trading inside a consolidation triangle after a sharp rally, forming a potential bullish pennant. A breakout above ₹1500 could trigger a fresh uptrend toward ₹1700-1800. Watch volume and RSI for confirmation.
Disclaimer
The information and publications are not meant to be, and do not constitute, financial, investment, trading, or other types of advice or recommendations supplied or endorsed by TradingView. Read more in the Terms of Use.
Disclaimer
The information and publications are not meant to be, and do not constitute, financial, investment, trading, or other types of advice or recommendations supplied or endorsed by TradingView. Read more in the Terms of Use.