
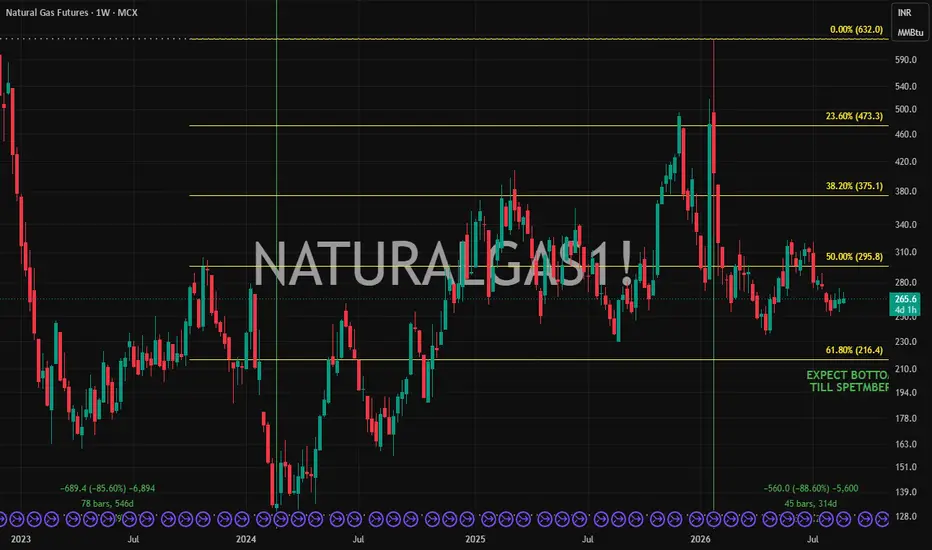
Natural Gas Futures – Weekly Analysis
Price is currently trading around 266.
I am watching the 210–222 zone as a potential buying area.
The setup is based on:
Weekly structure & historical support
61.8% Fibonacci retracement zone
Gann time-cycle observation
Potential Elliott Wave flat correction completing around September-end
Potential upside levels:
🎯 295
🎯 375
🎯 473
The idea is conditional — I would look for a suitable reversal/confirmation near the 210–222 zone rather than entering blindly.
Time window: September 2026
⚠️ Subject to market risk. This is a technical analysis idea, not financial advice.
Tags
#NaturalGas #MCX #TradingIdea #TechnicalAnalysis #Fibonacci #Gann #ElliottWave #Commodities #Trading
Trade active

Disclaimer
The information and publications are not meant to be, and do not constitute, financial, investment, trading, or other types of advice or recommendations supplied or endorsed by TradingView. Read more in the Terms of Use.
Disclaimer
The information and publications are not meant to be, and do not constitute, financial, investment, trading, or other types of advice or recommendations supplied or endorsed by TradingView. Read more in the Terms of Use.