
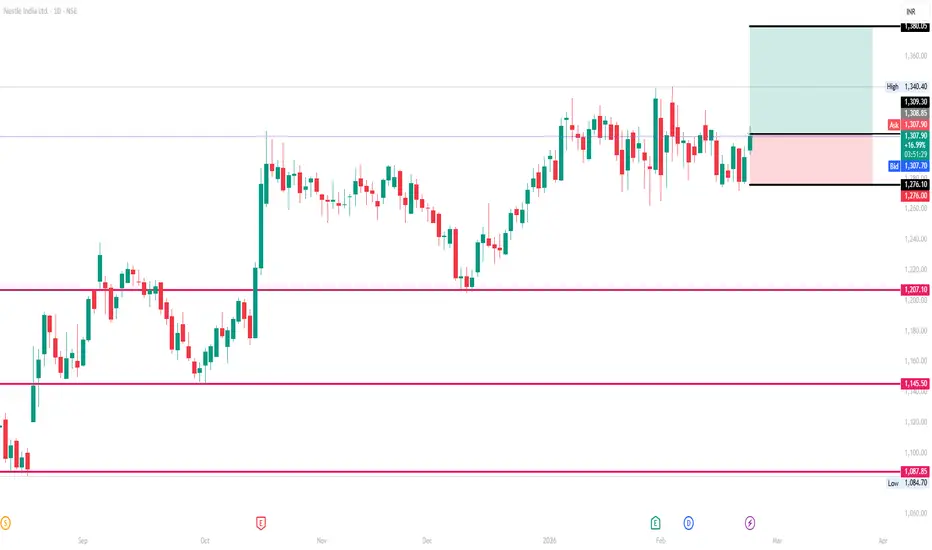
📊 Current Price Context (Daily)
Latest price around **₹1,293–₹1,308 ** (varies slightly through the session) — trading near recent highs for the day.
52-week range: High ~₹1,340 | Low ~₹1,055.
📌 Intraday Range (Observed Today)
Today’s high: ~₹1,314
Today’s low: ~₹1,295
This gives a sense of the immediate intraday swing range for the session:
Bullish upside if above ~₹1,304–₹1,314; downside pressure below ~₹1,280–₹1,295.
📊 Indicators (Short-Term)
Pivot-based technicals suggest a neutral-to-slightly bullish intraday bias, with price action near pivots and moderate upside resistances.
Moving averages and oscillators (like RSI) around neutral mid-range, indicating no extreme overbought/oversold on daily.
📌 Summary:
On a 1-day timeframe, the key levels to watch for Nestle India are:
Bullish levels:
Break above ₹1,304 (R1) → test ₹1,315 (R2), ₹1,329 (R3)
Bearish levels:
Drop below ₹1,280 (S1) → test ₹1,265 (S2), ₹1,255 (S3)
Pivot zone: ~₹1,290 (neutral pivot reference) — price above this suggests short-term strength; below it suggests short-term weakness.

Related publications
Disclaimer
The information and publications are not meant to be, and do not constitute, financial, investment, trading, or other types of advice or recommendations supplied or endorsed by TradingView. Read more in the Terms of Use.
Related publications
Disclaimer
The information and publications are not meant to be, and do not constitute, financial, investment, trading, or other types of advice or recommendations supplied or endorsed by TradingView. Read more in the Terms of Use.