
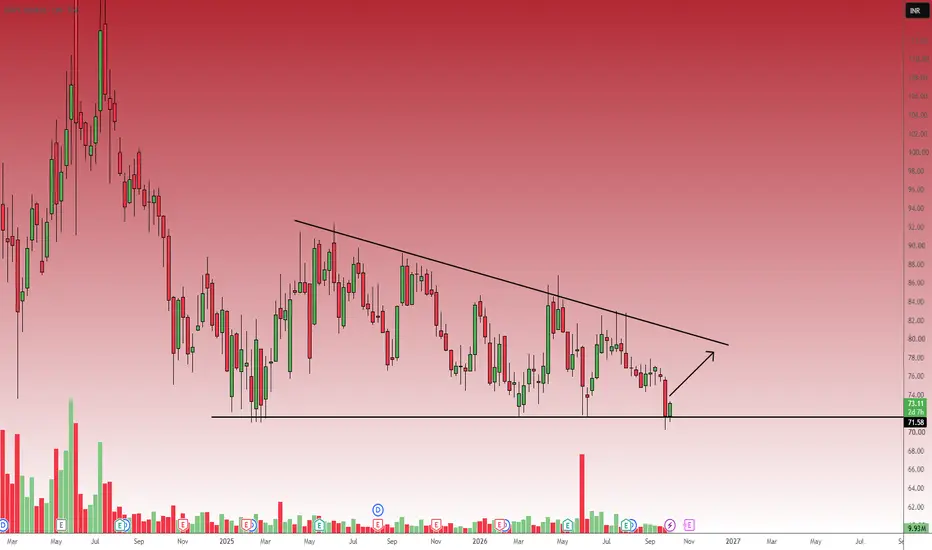
Based on the weekly timeframe NHPC is currently at a critical technical juncture, compressing within a large structure bounded by declining highs and a flat support base.
Chart Analysis:
Major Support: The stock has established a highly resilient horizontal support zone around the 71.50 - 72.00 level (marked by the black horizontal line at 71.58).
The price has tested this floor multiple times over the past several months, and we are currently seeing a fresh bounce forming a bullish weekly candle at 73.10.
Dynamic Resistance: A clear descending trendline connecting the previous swing highs is acting as continuous dynamic resistance, squeezing the price action downward.
The Setup: This structure resembles a descending triangle.
While descending triangles can often break to the downside, the current bounce off the baseline offers a highly favorable Risk-to-Reward (R:R) ratio for a long position, anticipating a move back up to the trendline.
Trade Plan:
Entry Point: Consider entries near the current market price (73.10), or on minor pullbacks closer to the 72.00 support level.
Stop Loss: A strict stop loss should be placed below the support wicks at 69.00 (on a weekly closing basis).
If the stock breaks and sustains below the 71.50 zone, the bullish thesis is invalidated, signaling a structural breakdown.
Targets:
Target 1 (Conservative): 79.00 - 80.00 (Meeting the descending trendline resistance).
Target 2 (Aggressive): 86.00 (Previous major swing high, valid only if the stock successfully breaks out above the descending trendline).
Target 3 (Long-term): 92.00
Chart Analysis:
Major Support: The stock has established a highly resilient horizontal support zone around the 71.50 - 72.00 level (marked by the black horizontal line at 71.58).
The price has tested this floor multiple times over the past several months, and we are currently seeing a fresh bounce forming a bullish weekly candle at 73.10.
Dynamic Resistance: A clear descending trendline connecting the previous swing highs is acting as continuous dynamic resistance, squeezing the price action downward.
The Setup: This structure resembles a descending triangle.
While descending triangles can often break to the downside, the current bounce off the baseline offers a highly favorable Risk-to-Reward (R:R) ratio for a long position, anticipating a move back up to the trendline.
Trade Plan:
Entry Point: Consider entries near the current market price (73.10), or on minor pullbacks closer to the 72.00 support level.
Stop Loss: A strict stop loss should be placed below the support wicks at 69.00 (on a weekly closing basis).
If the stock breaks and sustains below the 71.50 zone, the bullish thesis is invalidated, signaling a structural breakdown.
Targets:
Target 1 (Conservative): 79.00 - 80.00 (Meeting the descending trendline resistance).
Target 2 (Aggressive): 86.00 (Previous major swing high, valid only if the stock successfully breaks out above the descending trendline).
Target 3 (Long-term): 92.00

Disclaimer
The information and publications are not meant to be, and do not constitute, financial, investment, trading, or other types of advice or recommendations supplied or endorsed by TradingView. Read more in the Terms of Use.
Disclaimer
The information and publications are not meant to be, and do not constitute, financial, investment, trading, or other types of advice or recommendations supplied or endorsed by TradingView. Read more in the Terms of Use.