
NIFTY 50: Elliott Wave Warning of a Potential Multi-Year Bear Market
Applied Elliott Wave analysis on the weekly timeframe.
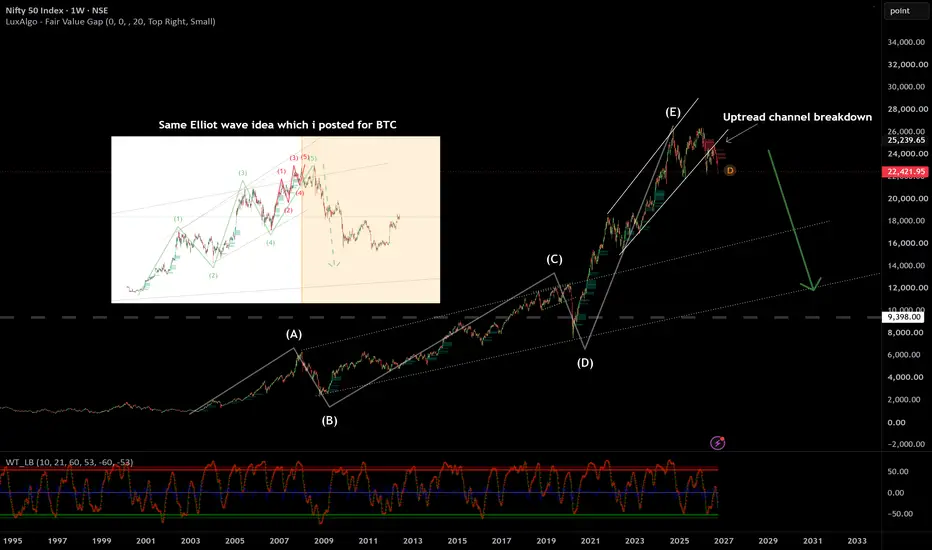
NIFTY appears to have completed a large ABCDE corrective/wedge structure.
Wave (E) may have topped near the recent all-time highs around 26,000.
Current price action suggests weakness and a possible trend reversal.
Similar Elliott Wave setup was previously observed in my BTC analysis before a major decline.
Momentum is fading on higher timeframes despite prices remaining elevated.
A break below major support levels could confirm the bearish scenario.
If the wave count is correct, NIFTY may enter a multi-year bear market phase.
Long-term downside targets could be significantly lower than current levels, with historical support zones becoming key areas of interest.
A sustained breakout above the all-time high would invalidate this bearish count and require a re-evaluation.
My View:
The risk-reward currently favors caution. NIFTY looks to be at a critical point where a completed Elliott Wave structure could mark the end of a long-term bull cycle and the beginning of a major correction.
Not Financial Advice. Trade with proper risk management.
#NIFTY #NIFTY50 #ElliottWave #BearMarket #NSE #TechnicalAnalysis #TradingView #WaveTheory #IndianStockMarket #MarketCrash #PriceAction #Investing #LongTermView
Note
If we go back in time 2004 to 2009 on NIFTY 50 same Elliot wave pattern got executed correctly. which I marked 12345 waves pattern, and marked A-B correction in larger scale

Disclaimer
The information and publications are not meant to be, and do not constitute, financial, investment, trading, or other types of advice or recommendations supplied or endorsed by TradingView. Read more in the Terms of Use.
Disclaimer
The information and publications are not meant to be, and do not constitute, financial, investment, trading, or other types of advice or recommendations supplied or endorsed by TradingView. Read more in the Terms of Use.