
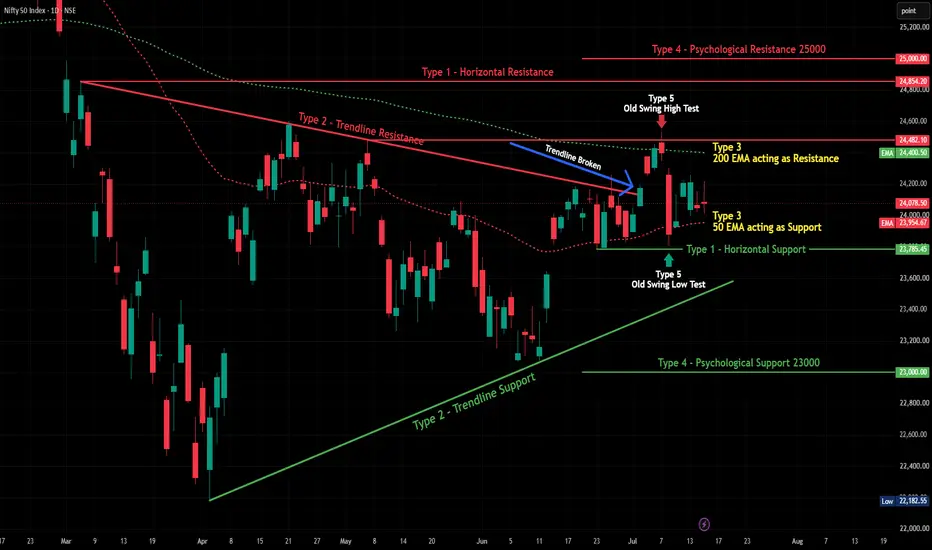
Overview
If you're new to charts, here's the good news — almost everything else in technical analysis is built on top of just two ideas: support and resistance. Once these click, patterns, trendlines, and setups all start making a lot more sense. Let's break it down simply.
What Is Support?
Support is just a price level where buyers have shown up before. Think of it like a floor — price falls toward it, buyers step in, and it bounces back up. It doesn't always hold, but it's a zone worth watching.
What Is Resistance?
Resistance is the opposite — a price level where sellers have shown up before. Think of it like a ceiling — price rises toward it, sellers step in, and it falls back down.
Different Types of Support & Resistance
Not all support and resistance look the same. Here are the common types you'll come across:
Type 1 - Horizontal Support/Resistance — the simplest kind. Just a flat price level where price has bounced or reversed multiple times in the past. Easiest one to spot for beginners.
Type 2 - Trendline Support/Resistance — a sloped line connecting a series of highs or lows. Rising trendlines act as support, falling trendlines act as resistance.
Type 3 - Moving Average Support/Resistance — averages like the 50 EMA or 200 EMA often act like a "floor" or "ceiling" too, especially on higher timeframes like weekly or monthly charts.
Type 4 - Psychological Levels — round numbers like 1,000, 500, or 100 often act as support/resistance simply because a lot of traders place orders around these numbers.
Type 5 - Old Swing Highs/Lows — a previous high or low left behind on the chart tends to matter again later, even months down the line.
How to Actually Identify These on a Chart
Here's a simple way to start:
Look left. Has price touched this level before? The more times it's been tested, the more people are watching it.
Look for reactions, not just touches. A level only matters if price actually reacted there — bounced, reversed, or paused.
Zoom out. A level that matters on the weekly chart is usually more important than one that only shows up on the 5-minute chart.
How to "Play" Support & Resistance
Once you've spotted a level, here's how traders typically use it:
Buying near support: Some traders wait for price to reach support and show signs of holding (like a strong bounce candle) before buying.
Selling/booking profit near resistance: Others use resistance as a place to book profits or expect a pause.
The flip rule: Here's a neat trick — once resistance is broken, it often becomes support going forward (and vice versa). This is called a "role reversal" and it's one of the most useful ideas in trading.
Waiting for a retest: As we always prefer, it's usually safer to wait for price to retest a broken level and confirm it's holding, rather than jumping in the moment it breaks.
A Common Beginner Mistake
New traders often think a level is either "100% support" or "not support at all." In reality, these are zones, not exact lines — think of them as an area, not a single price. Give some room around the number rather than expecting a perfect bounce to the rupee.
Beginner's Lesson
The next time you open a chart, before looking at any indicator or pattern, just ask: where has price reacted before? Mark those zones first. You'll be surprised how much of the "story" of a stock becomes clear just from doing this one simple step.
Conclusion
Support and resistance aren't fancy or complicated — they're just the market's memory of where buyers and sellers have shown up before. Master this one concept, and a lot of the rest of technical analysis starts falling into place naturally.
For educational purposes only. Chart shown is for illustration only. Not financial advice

📈 HK Trading Community | Market Structure & Indicator Updates
Telegram: t.me/trendstrike1000
Website: quantumedgepro.netlify.app/
Real traders are built through learning,not tip hunting.So Start Learning How the Market Really Works
Telegram: t.me/trendstrike1000
Website: quantumedgepro.netlify.app/
Real traders are built through learning,not tip hunting.So Start Learning How the Market Really Works
Disclaimer
The information and publications are not meant to be, and do not constitute, financial, investment, trading, or other types of advice or recommendations supplied or endorsed by TradingView. Read more in the Terms of Use.