Top-Down Nifty 50 Price Structure Analysis for 03rd of December 2025. The day is Wednesday.
(1) Monthly Time Frame:
Red candle. So far, it is an inside month. The long-term trend is bullish, but the short-term trend shows weakness. Strong resistance is at levels 26300 and 26150. Strong support is at levels 26000 and 26850. The market is showing weakness at the all-time high (ATH). The view is indecisive to bearish.
(2) Weekly Time Frame:
Red Marubozu. The candle engulfed the body of the last week. A clear sign of weakness. Now major resistance is in the zone 26150 - 26100. Minor support is at level 26000. If level 26000 is breached, then level 25850 is reachable. No bearish trade till the price goes above the 26150 level. The view is bearish.
(3) Daily Time Frame:
Back-2-back 4 red days. Price gave a breakdown from level 26150, confirming the consolidation zone (26300 - 26150) as a major distribution zone. No, the previous consolidation zone is a major resistance. Take no bullish trade till price sustains above the level 26150. Every upmove should be doubted. A minor support is at level 26000. If level 26000 is breached, then there is a high chance of breaking down to level 25850. The view is bearish.
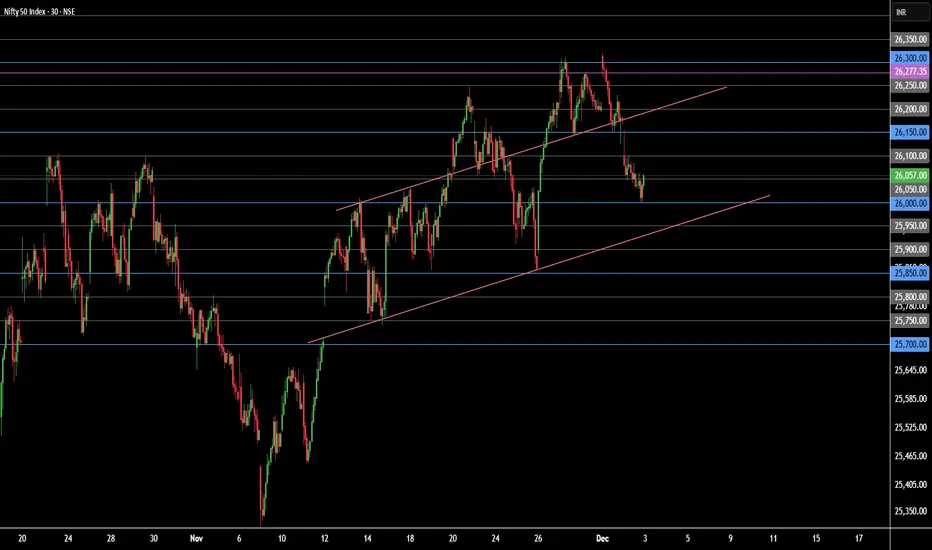
(4) 30-Minute Time Frame:
A clear sign of a sell-off. There is weakness in the market structure. Very strong resistance is at level 26150. No sign of bullishness until the price starts to trade above the level 26150. Every up move should be doubted. Minor support is at level 26000. The view is bearish.
No Trading Zone (NTZ): 26150 - 26000.
Major resistance: 26150.
Minor Support: 26000.
Probable first bearish target: 25850 (if there is a breakdown below 26000).
Bullish Scenario Set-Up:
(i) Price sustains above the opening price.
(ii) Price sustains above the level 26150.
(iii) Price forms a higher highs and higher lows structure above the level 26150.
Beairsh Scenario Set-Up:
(i) Price sustains below the opening price.
(ii) Price decisively breaches (or breaks down) level 26000.
Event:
No expiries on Wednesday. No high-impact event. However, a high-impact event is on 05 December (Friday) this week.
Expectations (Hypothesis and insight from the trade planning):
(i) There is a clear sign of weakness in the price structure. The view is bearish.
(ii) The previous zone of consolidation (26300 - 26150) is now a major zone is resistance. Any up move should be doubted.
(iii) Take no bullish trade till price forms a higher highs and lower lows structure above the level 26150.
(iv) Look only for the bearish trade.
(v) In case either a bullish or a bearish scenario does not happen, then don't trade. Trade only when conditions are met.
NOTE:
"Mark your points. Trade your points. Price is God. Anything can happen. Therefore, trade what you see, not what you believe."
Happy Trading!
(1) Monthly Time Frame:
Red candle. So far, it is an inside month. The long-term trend is bullish, but the short-term trend shows weakness. Strong resistance is at levels 26300 and 26150. Strong support is at levels 26000 and 26850. The market is showing weakness at the all-time high (ATH). The view is indecisive to bearish.
(2) Weekly Time Frame:
Red Marubozu. The candle engulfed the body of the last week. A clear sign of weakness. Now major resistance is in the zone 26150 - 26100. Minor support is at level 26000. If level 26000 is breached, then level 25850 is reachable. No bearish trade till the price goes above the 26150 level. The view is bearish.
(3) Daily Time Frame:
Back-2-back 4 red days. Price gave a breakdown from level 26150, confirming the consolidation zone (26300 - 26150) as a major distribution zone. No, the previous consolidation zone is a major resistance. Take no bullish trade till price sustains above the level 26150. Every upmove should be doubted. A minor support is at level 26000. If level 26000 is breached, then there is a high chance of breaking down to level 25850. The view is bearish.
(4) 30-Minute Time Frame:
A clear sign of a sell-off. There is weakness in the market structure. Very strong resistance is at level 26150. No sign of bullishness until the price starts to trade above the level 26150. Every up move should be doubted. Minor support is at level 26000. The view is bearish.
No Trading Zone (NTZ): 26150 - 26000.
Major resistance: 26150.
Minor Support: 26000.
Probable first bearish target: 25850 (if there is a breakdown below 26000).
Bullish Scenario Set-Up:
(i) Price sustains above the opening price.
(ii) Price sustains above the level 26150.
(iii) Price forms a higher highs and higher lows structure above the level 26150.
Beairsh Scenario Set-Up:
(i) Price sustains below the opening price.
(ii) Price decisively breaches (or breaks down) level 26000.
Event:
No expiries on Wednesday. No high-impact event. However, a high-impact event is on 05 December (Friday) this week.
Expectations (Hypothesis and insight from the trade planning):
(i) There is a clear sign of weakness in the price structure. The view is bearish.
(ii) The previous zone of consolidation (26300 - 26150) is now a major zone is resistance. Any up move should be doubted.
(iii) Take no bullish trade till price forms a higher highs and lower lows structure above the level 26150.
(iv) Look only for the bearish trade.
(v) In case either a bullish or a bearish scenario does not happen, then don't trade. Trade only when conditions are met.
NOTE:
"Mark your points. Trade your points. Price is God. Anything can happen. Therefore, trade what you see, not what you believe."
Happy Trading!
Disclaimer
The information and publications are not meant to be, and do not constitute, financial, investment, trading, or other types of advice or recommendations supplied or endorsed by TradingView. Read more in the Terms of Use.
Disclaimer
The information and publications are not meant to be, and do not constitute, financial, investment, trading, or other types of advice or recommendations supplied or endorsed by TradingView. Read more in the Terms of Use.