Top-Down Nifty 50 Price Structure Analysis for 01st December 2025. The day is Monday.
(1) Monthly Time Frame:
A strong bullish candle. Major support is 26100. Major resistance is 26300. The view is bullish.
(2) Weekly Time Frame:
A green long-legged doji candle. The major support is 26100. The major resistance is 26300. The view is bullish to indecisive. Stay bullish until 26100 is decisively broken. Rest stay bullish.
(3) Daily Time Frame:
Back-2-Back 2 days red spinning tops. The two days of indecisive price movement came after a massive bullish move on 26 November 2025. So, a major consolidation is happening in the zone of 26300 - 26150. The zone is also a no-trading zone (NTZ). The view is indecisive. No long and no short. Friday's candle is a perfect inside candle and a spinning top. No bullish trade till 26300 is decisively breached.
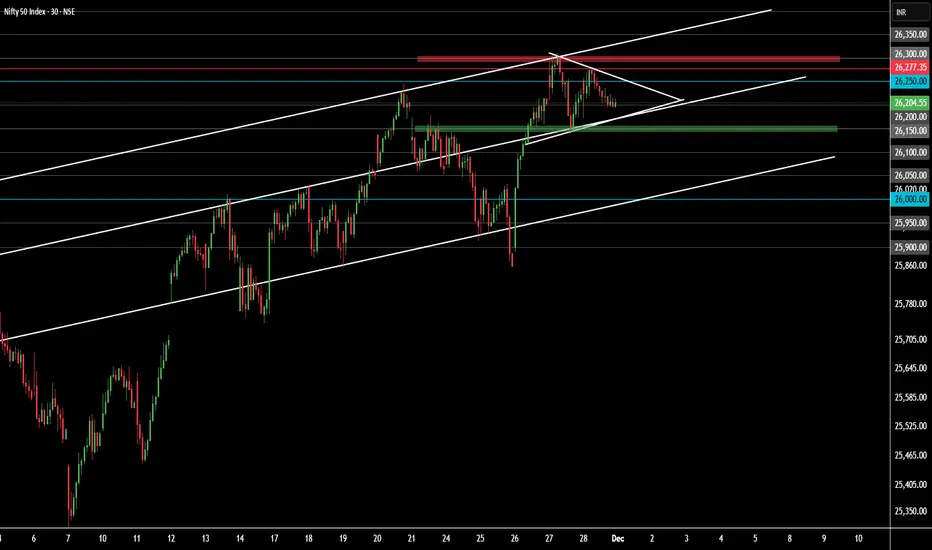
(4) 30-Minute Time Frame:
Price has formed a perfect pennant. It means the price structure is indecisive. Market needs much bullish force to breach the levels 26250, 26277.35 {previous all-time high (ATH)}, and 26300. Price closed above 26200. The view is indecisive till either side breaks is confirmed in the markets.
Bullish Scenario Set-Up:
(i) Price sustains above the opening price.
(ii) Price starts to trade above 26250.
(iii) Price breaks out of the pennant.
(iv) Price shows the promise of breaking 3 resistances - 26250, 26277.35 (previous ATH), and 26300.
Bearish Scenario Set-Up:
(i) Price sustains below the opening price.
(ii) Price breaks down the pennant.
(iii) Price decisively trades below the level 25150 and shows signs of breaching 26100.
No Trading Zone (NTZ): 26300 - 26150.
Events: No expiries on Monday. No high-impact events on Monday.
Expectations (Hypothesis from Trade Planning):
As per the present scenario, the market is indecisive. Structural clarity is possible when the price gives a breakout or breakdown from the pennant. Prices trading above 26250 will show signs of bullish continuation. On the contrary, price trading below 26150 will show signs of bearishness. Lastly, price needs a strong bullish force to breach levels 26250, 26277.55, and 26300. Wait patiently for either a breakout or breakdown.
NOTE:
"Mark your points. Trade your points. Price is God. Anything can happen. Therefore, trade what you see, not what you believe."
Happy Trading!
(1) Monthly Time Frame:
A strong bullish candle. Major support is 26100. Major resistance is 26300. The view is bullish.
(2) Weekly Time Frame:
A green long-legged doji candle. The major support is 26100. The major resistance is 26300. The view is bullish to indecisive. Stay bullish until 26100 is decisively broken. Rest stay bullish.
(3) Daily Time Frame:
Back-2-Back 2 days red spinning tops. The two days of indecisive price movement came after a massive bullish move on 26 November 2025. So, a major consolidation is happening in the zone of 26300 - 26150. The zone is also a no-trading zone (NTZ). The view is indecisive. No long and no short. Friday's candle is a perfect inside candle and a spinning top. No bullish trade till 26300 is decisively breached.
(4) 30-Minute Time Frame:
Price has formed a perfect pennant. It means the price structure is indecisive. Market needs much bullish force to breach the levels 26250, 26277.35 {previous all-time high (ATH)}, and 26300. Price closed above 26200. The view is indecisive till either side breaks is confirmed in the markets.
Bullish Scenario Set-Up:
(i) Price sustains above the opening price.
(ii) Price starts to trade above 26250.
(iii) Price breaks out of the pennant.
(iv) Price shows the promise of breaking 3 resistances - 26250, 26277.35 (previous ATH), and 26300.
Bearish Scenario Set-Up:
(i) Price sustains below the opening price.
(ii) Price breaks down the pennant.
(iii) Price decisively trades below the level 25150 and shows signs of breaching 26100.
No Trading Zone (NTZ): 26300 - 26150.
Events: No expiries on Monday. No high-impact events on Monday.
Expectations (Hypothesis from Trade Planning):
As per the present scenario, the market is indecisive. Structural clarity is possible when the price gives a breakout or breakdown from the pennant. Prices trading above 26250 will show signs of bullish continuation. On the contrary, price trading below 26150 will show signs of bearishness. Lastly, price needs a strong bullish force to breach levels 26250, 26277.55, and 26300. Wait patiently for either a breakout or breakdown.
NOTE:
"Mark your points. Trade your points. Price is God. Anything can happen. Therefore, trade what you see, not what you believe."
Happy Trading!
Note
It is 09:45 AM(1) There is a huge price gap up. Thus, the market is trying to stabilize.
(2) However, price is still getting support from the previous ATH.
(3) Level 26300 is now a major resistance.
(4) First 15 minutes candle is not broken either way.
(5) There is a possibility of gap fill.
Presently, the market is indecisive.
Condition for Bullish scenario:
(1) In intraday, price must sustain above the opening price.
(2) Price must sustain above level 26300.
(3) If not then no trades.
Trade active
It is 10:16 A.M(1) The first 1 hour candle is red.
(2) The gap below is not yet filled.
(3) Price is still trading below the opening price.
(4) However, the bullish sentiment is still intact.
(5) Price is choppy and indecisive around the previous ATH (26277).
(6) Sentiments are bullish to indecisive.
Major resistance levels in the current scenario:
(1) The opening price is a major resistance.
(2) Level 26300 is a major barrier.
Condition for Bullish trade:
(1) A green candle engulfs the first 1-hour red candle and shows signs of an upward move.
(2) Price starts to decisively trade above the opening price.
Condition for Bearish trade:
(1) No such scenario of taking bearish trade.
Note: If either of the bullish or bearish conditions not fulfilled, then no trade. Wait patiently.
Note
It is 11:45 AM(1) Price is back in the consolidation area (or no trading zone) of 26300 - 26150.
(2) Gap up and bullish expectation early in the morning is failed.
(3) Price is trying to fill up the gap up.
(4) However, the price is still in a bullish phase.
Key Resistances that are Barrier to Bullish move:
(1) Today's opening price 26325.8
(2) Level 26300 (now a major resistance level)
(3) Previous ATH (26277)
Bullish Set-Up:
(1) No Bullish trade till price sustains above 26300.
Bearish Set-Up:
(1) No bearish trade till price decisively trades below the level 25150 and shows signs of breaching 26100.
No trading zone (26300 - 26150)
Note
It is 12:25 PM(1) There is a massive selling pressure from level 26300. Thus, level 26300 is confirmed to be the new super resistance zone.
(2) Selling has been happening for the last 3 hours. However, a bearish set-up is not formed as the long-term trend is still bullish.
(3) Price might take support at the level 26150. However, there are no signs of taking a bullish trade.
(4) No trading zone (NTZ) is still intact: 26300 - 26150.
Major Resistance Levels:
(i) Today's opening: 26325.
(ii) Level 26300.
(iii) Level 26277 (previous ATH).
(iv) Level 26200.
Major Support Levels:
(i) Level 26150.
(ii) Level 26100.
Presently, no trading.
Note
It is 13:30(1) In the daily time frame, there is a red morubozu. Strong selling below 26300.
(2) Consolidation Zone or NTZ is still intact - 26300 - 26150.
(3) Despite strong intraday selling, there is no shorting set-up.
(4) Levels 26150 and 26100 are still strong support.
(5) The consolidation of 26300 - 26150 is the result of the 26th November massive bullish move.
Insight:
(1) Take no bullish trade till price sustains above 26300.
(2) Take no bearish trade till level 26150 is decisively breached.
For now, no trading.
Note
It is 14:05(1) Today is a highly indecisive day.
(2) Price is trying to build strong support in the zone (26150 - 26200).
(3) Presently, the price is exactly in the middle of the NTZ: (26300 - 26150).
(4) The price is again trying to go towards (with bullish sentiment), the opening price.
Insight:
No trading in the zone - 26300 - 26150.
Probably, the price is consolidating, taking into consideration tomorrow's Nifty expiry.
Since there is no clear trend, avoid market participation.
It seems like a trapping market.
The pennant is still intact.
Today we had no trade.
Done for the day.
Disclaimer
The information and publications are not meant to be, and do not constitute, financial, investment, trading, or other types of advice or recommendations supplied or endorsed by TradingView. Read more in the Terms of Use.
Disclaimer
The information and publications are not meant to be, and do not constitute, financial, investment, trading, or other types of advice or recommendations supplied or endorsed by TradingView. Read more in the Terms of Use.