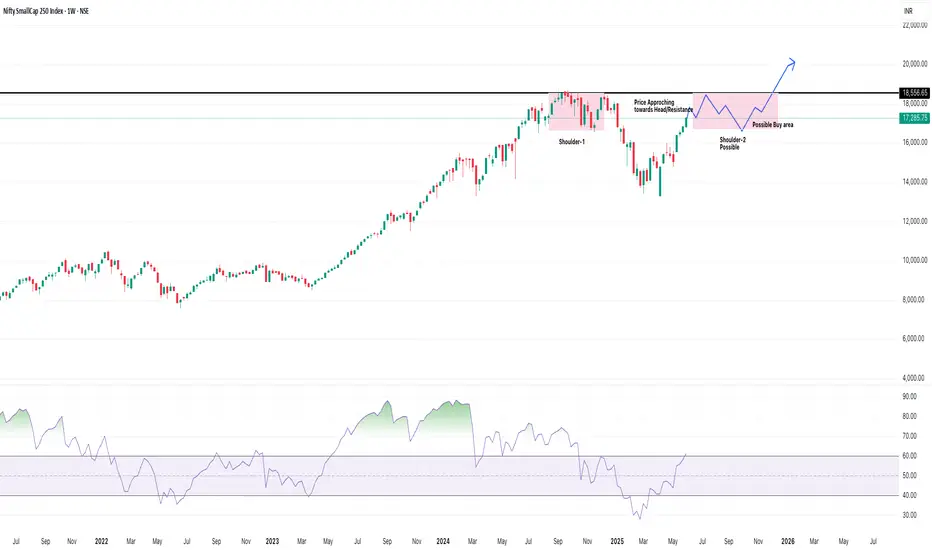
Formation of a Potential Head and Shoulders Pattern: The chart highlights the formation of what appears to be a "Shoulder-1" and a "Head" (the peak where resistance was met). A "Shoulder-2 Possible" is also indicated, suggesting the potential completion of an Inverse Head and Shoulders pattern.
Shoulder-1: The first peak on the left side before the main "Head."
Head: The highest point reached, coinciding with the strong resistance level.
Possible Shoulder-2: The current price action is forming what could be the right shoulder of the pattern.
"Price Approaching Towards Head/Resistance": The annotation correctly points out that the price is currently moving towards the "Head" and the strong resistance level at 18,505.05.
"Possible Buy Area": A green horizontal line around 16,900-17,000, labeled "Possible Buy area," suggests that if the price pulls back after testing the resistance, this region could offer a buying opportunity, potentially forming the right shoulder.
Projected Price Path: The chart shows a blue curved arrow indicating a potential future trajectory: a test of the resistance, a pullback to the "Possible Buy area" (to form Shoulder-2), and then a strong breakout above the 18,505.05 resistance towards higher levels (indicated by the upward blue arrow towards 20,000+).
Disclaimer
The information and publications are not meant to be, and do not constitute, financial, investment, trading, or other types of advice or recommendations supplied or endorsed by TradingView. Read more in the Terms of Use.
Disclaimer
The information and publications are not meant to be, and do not constitute, financial, investment, trading, or other types of advice or recommendations supplied or endorsed by TradingView. Read more in the Terms of Use.