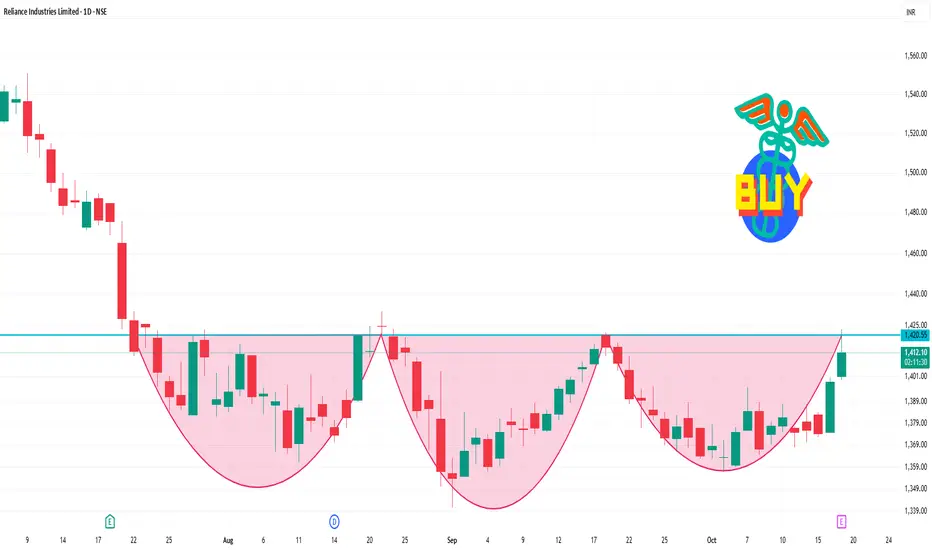
📈 Daily Support & Resistance Levels
Immediate Support: ₹1,399.10
Key Resistance: ₹1,417.80
Pivot Point: ₹1,407.53
These levels are based on standard pivot point calculations and indicate that the stock is trading just below the immediate resistance level, suggesting potential for upward movement.
🔧 Technical Indicators
RSI (14-day): 62.51 — Neutral to slightly bullish
MACD: 0.730 — Positive momentum
Moving Averages:
5-day SMA: ₹1,373.00 — Buy signal
50-day SMA: ₹1,350.00 — Buy signal
200-day SMA: ₹1,300.00 — Buy signal
Stochastic Oscillator: 75.00 — Overbought, indicating potential for a pullback
Supertrend: ₹1,414.07 — Mildly bearish
Parabolic SAR: ₹1,357.52 — Mildly bullish
These indicators suggest a generally positive trend, with some caution due to overbought conditions.
Related publications
Disclaimer
The information and publications are not meant to be, and do not constitute, financial, investment, trading, or other types of advice or recommendations supplied or endorsed by TradingView. Read more in the Terms of Use.
Related publications
Disclaimer
The information and publications are not meant to be, and do not constitute, financial, investment, trading, or other types of advice or recommendations supplied or endorsed by TradingView. Read more in the Terms of Use.