
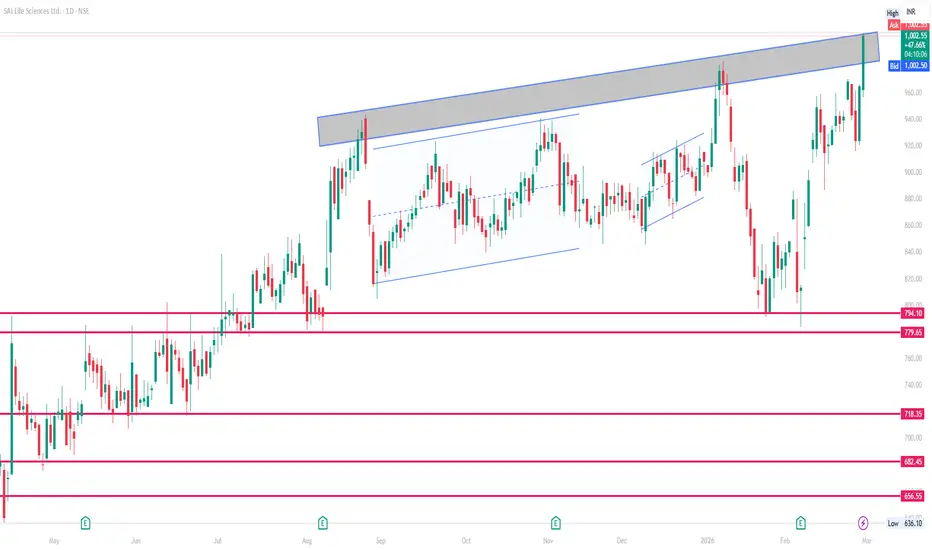
📊 Key Levels (Daily Pivot Support & Resistance)
Based on recent pivot point calculations and technical data:
Daily Pivot Point
🔹 Pivot: ~₹950.25 (central reference level)
Resistance Levels
🔺 R1: ~₹980 – ₹996
🔺 R2: ~₹996 – ₹1,026
🔺 R3: ~₹1,026+ (higher breakout zone)
Support Levels
🔻 S1: ~₹934 – ₹943
🔻 S2: ~₹904 – ₹921
🔻 S3: ~₹888 – ₹904
🧠 Context & Price Reference
The stock currently trades around ₹995–₹1,000 range (latest market snapshot).
The recent intraday low (~₹956) and high (~₹1,004) also act as near‑term support and resistance zones.
📈 How to Use These Levels
Bullish scenario: Break above R1 (~₹980–₹996) with volume could signal continuation toward R2/R3.
Bearish scenario: Failure at pivot (~₹950) and break below S1 (~₹934) may open S2/S3 zones.
Scalpers/Intraday: Use pivot as the midpoint reference for buy/sell zones within the trading session.
Note: These are technical reference levels for traders, not financial advice. Prices fluctuate continuously; always combine with real‑time charting and risk management.

Related publications
Disclaimer
The information and publications are not meant to be, and do not constitute, financial, investment, trading, or other types of advice or recommendations supplied or endorsed by TradingView. Read more in the Terms of Use.
Related publications
Disclaimer
The information and publications are not meant to be, and do not constitute, financial, investment, trading, or other types of advice or recommendations supplied or endorsed by TradingView. Read more in the Terms of Use.