
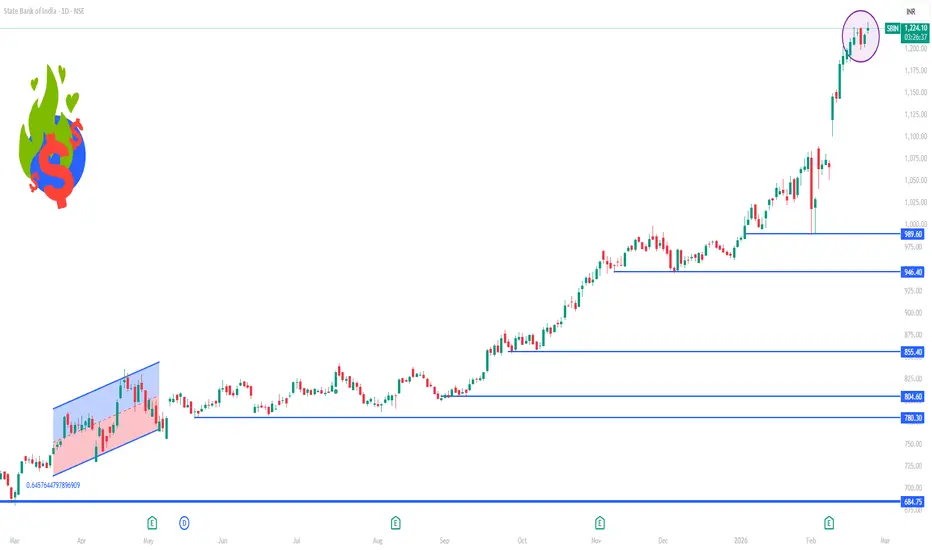
📊 Current price context
• SBIN is trading above ₹1,220 on the NSE recently (close to 52-week high).
📈 Daily Technical Levels (1D)
🔹 Resistance Levels
R1: ~₹1,221 – ₹1,222
R2: ~₹1,235 – ₹1,236
R3: ~₹1,245 – ₹1,247
🔹 Pivot
Pivot: ~₹1,210 – ₹1,211
🔹 Support Levels
S1: ~₹1,196 – ₹1,197
S2: ~₹1,185 – ₹1,186
S3: ~₹1,170 – ₹1,171
👉 These pivot and S/R levels are typical daily pivot point calculations used by traders to assess intraday directional bias and potential reversal zones.
🧠 How to Use These Levels (1-Day Chart)
Bullish bias: Price holding above the pivot (~₹1,210) suggests strength; rallies to R1/R2/R3 could follow.
Bearish risk: A break below S1 (~₹1,196) could accelerate selling toward S2/S3.
Intraday trades: Traders often watch reactions near pivot ± 1–3 support/resistance for entry/exit decisions.

Contact Knowledgehub for a detailed consultation: Dm on WhatsApp: [wa.link/a2o0kz]-
Phone No: [+91 93102 26243]-
Email: [tradingviewknowledgehub@gmail.com]---
-- Let’s achieve success together!
Phone No: [+91 93102 26243]-
Email: [tradingviewknowledgehub@gmail.com]---
-- Let’s achieve success together!
Related publications
Disclaimer
The information and publications are not meant to be, and do not constitute, financial, investment, trading, or other types of advice or recommendations supplied or endorsed by TradingView. Read more in the Terms of Use.