Based on the charts and the market's performance on Tuesday, October 14, the Sensex experienced a sharp pullback from its high, confirming strong selling pressure and a Market Structure Shift (MSS) to the downside.
Detailed Market Structure Breakdown
4-Hour Chart (Macro Trend)
Structure: The Sensex has confirmed a strong short-term corrective phase. The price failed to sustain the move above the 82,300 resistance and broke below the lower trendline of its short-term ascending channel. The strong red candle confirms bears are back in control, pushing the price toward the major support area.
Key Levels:
Major Supply (Resistance): 82,200 - 82,400. This area is the critical overhead supply zone (Order Block) and the high of the recent swing.
Major Demand (Support): 81,600 - 81,800. This area is the key FVG (Fair Value Gap) and the new must-hold zone for the current uptrend. Breaking this level would signal a deeper correction.
Outlook: The short-term bias is sideways-to-bearish. The market is expected to test the 81,600 - 81,800 support zone.
1-Hour Chart (Intermediate View)
Structure: The 1H chart shows a clear Break of Structure (BOS) to the downside. The price is now trading within a descending channel, having broken the immediate swing low. The current price is right on the 9-period EMA, suggesting a temporary bounce is possible before further selling.
Key Levels:
Immediate Resistance: 82,200 (Upper trendline of the descending channel).
Immediate Support: 81,800 (Lower boundary of the current corrective channel).
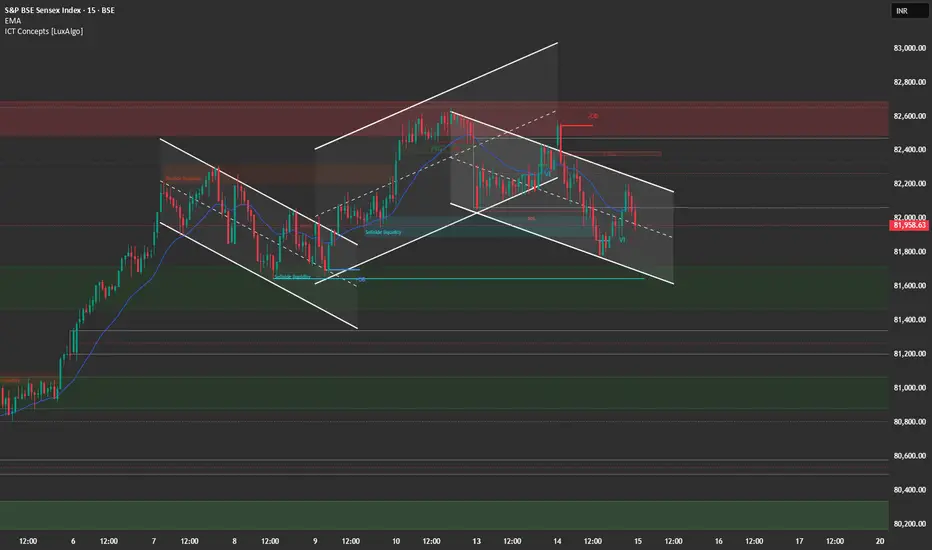
15-Minute Chart (Intraday View)
Structure: The 15M chart confirms the sharp selling pressure. The market broke down from the 82,300 level and is now forming a descending channel. The late-day selling (marked by the red candles) indicates bears were dominant.
Key Levels:
Intraday Supply: 82,200.
Intraday Demand: 81,800.
Outlook: Bearish. A "Sell on Rise" strategy is recommended near 82,000 - 82,200.
📈 Trade Plan (Wednesday, 15th October)
Market Outlook: The Sensex is undergoing a sharp short-term correction. The primary strategy will be to sell into strength or on a breakdown of immediate support. Tech Mahindra and Persistent Systems Q2 results are due today, which may provide sector-specific volatility.
Bearish Scenario (Primary Plan)
Justification: The breakdown of the channel and the strong rejection from the highs favor continuation of the correction.
Entry: Short entry on a successful retest and rejection of the 82,200 level (upper channel resistance/FVG). Alternatively, short a decisive break and 15-minute candle close below 81,800.
Stop Loss (SL): Place a stop loss above 82,400 (above the immediate swing high/supply zone).
Targets:
T1: 81,600 (Major FVG support).
T2: 81,200 (Next major support).
Bullish Scenario (Counter-Trend/Reversal Plan)
Justification: Only valid if Q2 results provide a strong positive surprise, leading to a move that negates the current selling pressure.
Trigger: A sustained move and close above the resistance at 82,400.
Entry: Long entry on a confirmed 15-minute close above 82,400.
Stop Loss (SL): Below 82,100.
Targets:
T1: 82,600 (Upper resistance).
T2: 82,900 (Extension target).
Key Levels for Observation:
Immediate Decision Point: 81,800 - 82,200 zone.
Bearish Confirmation: A break and sustained move below 81,800.
Bullish Confirmation: A move back above 82,400.
Line in the Sand: 81,800. Below this level, the short-term bullish bias is nullified.
Disclaimer
The information and publications are not meant to be, and do not constitute, financial, investment, trading, or other types of advice or recommendations supplied or endorsed by TradingView. Read more in the Terms of Use.
Disclaimer
The information and publications are not meant to be, and do not constitute, financial, investment, trading, or other types of advice or recommendations supplied or endorsed by TradingView. Read more in the Terms of Use.