
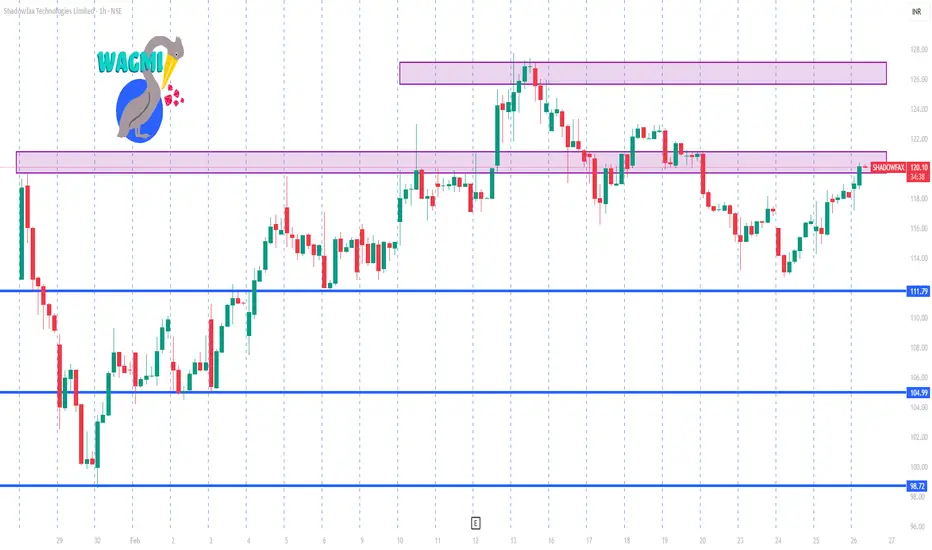
📈 Live Price Snapshot (Recent)
Current Price (approx): ₹120.0 – fluctuating between ₹117.18 (low) and ₹120.40 (high) during the current session.
📊 Intraday / 1-Hour Trading Levels (Key)
(These are typical pivot point levels used by intraday traders — usually recalculated daily, so use live charts for exact real-time values)
🔹 Pivot & Support / Resistance Levels (from recent NC/Technical data)
Daily pivot-based levels (guide for 1-hour strategies):
Pivot Point: ~ ₹117.24
Resistance 1: ~ ₹120.19
Resistance 2: ~ ₹121.96
Resistance 3: ~ ₹124.91
Support 1: ~ ₹115.47
Support 2: ~ ₹112.52
Support 3: ~ ₹110.75
These pivot levels are typically derived from the prior session’s high/low/close and are used by 1-hour chart traders to anticipate likely bounce/reversal zones within the session.
📌 How to Use These in a 1-Hour Chart
Bullish break above ₹120.2 — a sign price could gain short-term momentum.
Sustained price above the pivot (₹117.2) usually signals intra-day strength.
Support at ₹115–₹112 — key zone for stops or dip buys intra-session.
Break below ₹110.7 may signal deeper short-term weakness.
📉 Intraday Price Behavior
Based on the latest data:
Today’s low ~₹117.18 and high ~₹120.4 shows a tight intra-day range — typical for 1-hour frame pivot plays.
The stock has been trading close to its pivot and first resistance, which is often where 1-hour momentum shifts happen in intraday charts.

Contact Knowledgehub for a detailed consultation: Dm on WhatsApp: [wa.link/a2o0kz]-
Phone No: [+91 93102 26243]-
Email: [tradingviewknowledgehub@gmail.com]---
-- Let’s achieve success together!
Phone No: [+91 93102 26243]-
Email: [tradingviewknowledgehub@gmail.com]---
-- Let’s achieve success together!
Related publications
Disclaimer
The information and publications are not meant to be, and do not constitute, financial, investment, trading, or other types of advice or recommendations supplied or endorsed by TradingView. Read more in the Terms of Use.