
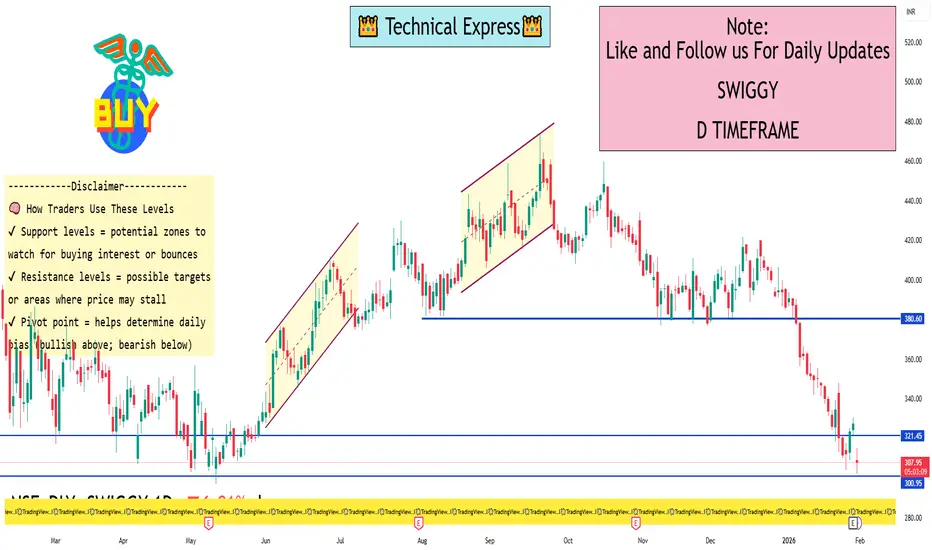
📊 SWIGGY – 1-Day Time Frame Key Levels (Daily Technical View)
📍 Latest Price Context (Approx)
Current/Live price range (recent session): ~₹305–₹315 (trading range today)
🔑 Daily Support Levels
These are price zones where buying interest could emerge if the stock dips:
📌 S1 (Immediate Support): ~₹313–₹315
📌 S2: ~₹307–₹310
📌 S3 (Deeper support): ~₹295–₹300
(levels help define where the stock may stabilize on a pullback)
📈 Daily Resistance Levels
These are zones where price may face selling pressure:
🔹 R1: ~₹329–₹330
🔹 R2: ~₹335–₹336
🔹 R3: ~₹345–₹346
(above these, the stock needs strong momentum to continue higher)
📊 Daily Pivot Levels
Pivot levels often act as reference for thematic direction:
📍 Pivot (Central daily level): ~₹326–₹327
(Above this = mildly bullish bias for the day; below this = bearish bias)
📌 Based on Technical Indicators
Short-term indicators show mixed to bearish bias in daily trend, with several oscillators and moving average signals leaning sell/oversold — reflecting current selling pressure in the market.

Related publications
Disclaimer
The information and publications are not meant to be, and do not constitute, financial, investment, trading, or other types of advice or recommendations supplied or endorsed by TradingView. Read more in the Terms of Use.
Related publications
Disclaimer
The information and publications are not meant to be, and do not constitute, financial, investment, trading, or other types of advice or recommendations supplied or endorsed by TradingView. Read more in the Terms of Use.