
Tata Investment Corporation : Inverted Head & Shoulder(breakout)
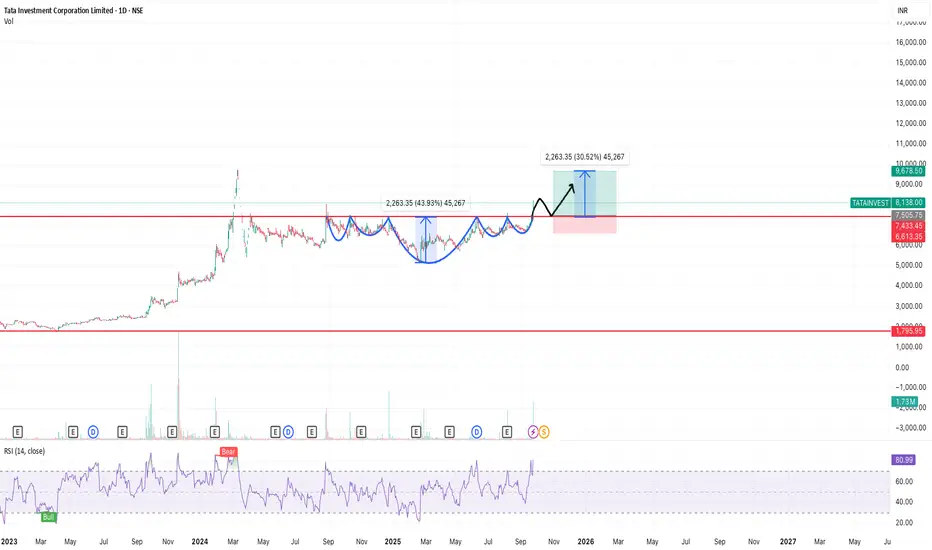
Tata Investment Corporation is forming a inverted head and Shoulder pattern right shoulder . On Friday last week , the stock is just around the neckline .
The Stock just gave breakout on daily, weekly and monthly candles and can be bought on retest
RSI daily reading is above 70 indicating a positive momentum.
Stop loss: 6600
Target: 9600
This is for learning purpose, please DYOR
The Stock just gave breakout on daily, weekly and monthly candles and can be bought on retest
RSI daily reading is above 70 indicating a positive momentum.
Stop loss: 6600
Target: 9600
This is for learning purpose, please DYOR
Trade closed: target reached

Disclaimer
The information and publications are not meant to be, and do not constitute, financial, investment, trading, or other types of advice or recommendations supplied or endorsed by TradingView. Read more in the Terms of Use.
Disclaimer
The information and publications are not meant to be, and do not constitute, financial, investment, trading, or other types of advice or recommendations supplied or endorsed by TradingView. Read more in the Terms of Use.